
1. Introduction
Over the past 30 years, many countries have made remarkable progress in reducing infant and child malnutrition. Nevertheless, in South Africa, rates of malnutrition and stunting, in particular, continue to remain high. It has been reported that approximately 25% of children are stunted, while acute malnutrition is responsible for over 30% of in-hospital deaths ( 1 ). These trends reveal that nutritional intake levels are consistently low and inadequate, often attributable to increased food insecurity. Infants and young children’s nutritional situation is believed to have further deteriorated after the 2008 food crisis, escalating political instability, threats of various conflicts, and, most recently, the coronavirus pandemic ( 2 , 3 ).
Before these challenges, the South African government introduced the National School Nutrition Programme (NSNP). Approximately 9 million learners receive meals under the NSNP each school day. The program is designed to fulfill 30-40% of a child’s recommended daily dietary allowance (RDA). The NSNP has collaborated with private and public organizations, such as the Tiger Brands Foundation (TBF), to augment its in-school nutrition contributions. As a result, additional breakfasts are now provided in many schools. These are crucial measures for mitigating food insecurity and poverty ( 4 ).
1.1. Food Insecurity and Poverty
While children have, for the most part, been spared from the direct health impacts of COVID-19 thus far, the crisis has had a profound effect on their well-being. In a comprehensive review of the health and nutrition concerns affecting school-age children in South Africa, Wenhold and colleagues ( 5 ) identified that young children are particularly vulnerable to nutritional deficiencies. However, in food insecurity and social instability, these nutritional issues often persist into their school-age years or may even worsen. The nutritional status of school children is primarily manifested through their growth and development due to their dietary habits and specific circumstances, such as illness. Children’s dietary intake is influenced by several factors that can be categorized into four main groups: (i) individual, (ii) interpersonal (social), (iii) community (cultural) and immediate physical environment, and (iv) societal and macro-environmental factors.
Schools and their students are frequently viewed as an ideal target for health and nutrition promotion efforts. This perspective is grounded in that schools regularly accommodate children for many years, during a crucial stage when lifelong habits are formed. Moreover, schools offer an environment in which healthy and safe eating practices, including resistance to social pressures, can be imparted by well-trained staff and practiced by the children ( 6 ). By reaching households and communities through their children, it becomes possible to disrupt the intergenerational cycle of malnutrition, poverty, and chronic diseases, particularly among girls. In South Africa, many public schools categorized in quintiles 1-3 provide breakfast in addition to the National School Nutrition Programme (NSNP) lunch, either through the NSNP itself or in partnership with other public or private entities, such as the TBF.
In 2012, the Human Sciences Research Council (HSRC) conducted the first South African Health and Nutrition Examination Survey (SANHANES-1). Utilizing other survey data, SANHANES-1 revealed that hunger rates had decreased from 52.3% in 1999 to 25.9% in 2008 and 26.0% in 2012, with some provinces like the Eastern Cape (36.2%) and Limpopo (30.8%) reporting higher rates in 2012 ( 7 ). As a result of various intervention programs, access to food at schools saw a significant increase, rising from 49% in November 2020 to 56% in April 2021, although it is worth noting that part of this increase may be attributed to changes in the reference period.
1.2. Nutrition Versus the Health Status of School-Aged Children
Malnutrition poses a significant challenge to a substantial portion of the global population. Undernutrition, in particular, accounted for up to 53% of all deaths among children under the age of five in recent years ( 8 ). Although this figure has declined globally, UNICEF estimates that nearly half of all deaths in children under five years of age still result from undernutrition ( 9 ). Despite improvements in the health and nutrition of impoverished children in South Africa, much more progress is needed.
According to research by Hendricks and colleagues ( 10 ), even before the onset of the COVID-19 pandemic, South African children grappled with a triple burden of undernutrition, overnutrition, and micronutrient deficiencies. These nutritional challenges severely compromised their health, cognitive development, survival, academic performance, and future economic productivity. As Hendricks and colleagues ( 10 ) reported, studies ( 11 , 12 ) consistently revealed a correlation between correct height-for-age measurements and cognitive or language abilities at age five, school enrollment and academic achievements during adolescence, and formal employment and psychological well-being between the ages of 20 and 22.
A child who experiences any form of malnutrition, particularly stunting, within the first 1,000 days of life is susceptible to various health challenges. These challenges include the development of fewer neural connections in the brain, leading to poor cognitive development. Regrettably, such damages are often irreversible. Stunted children are also known to perform poorly both academically and professionally, which can have a detrimental impact on a nation’s gross domestic product (GDP) ( 13 , 14 ). Deficiencies in childhood essential nutrition and early development can profoundly affect a child’s physical and mental growth and social development ( 14 ).
1.3. School Feeding Programs: The South African Context
Children’s rights to essential nutrition are enshrined in the South African Constitution. Section 27-1--b states that: “Everyone has the right to have access to healthcare services, sufficient food and water, and social security.” Section 27-2 requires that the state take reasonable legislative and other measures within its available resources to realize each of these rights progressively. In addition, Section 28-1 states that “Children have the right to basic nutrition, shelter, basic healthcare services, and social services.” ( 2 ). The state must employ legal measures to ensure that children’s parents and families can care for them and meet their basic nutritional needs and provide for the nutritional needs of children whose parents are absent, too poor, or cannot do so through policies and programs such as the Child Support Grant ( 15 ).
Providing breakfast for children in the morning is crucial, especially if they come to school hungry from impoverished homes. According to Kristjansson and colleagues ( 16 ) and Bundy and co-workers ( 17 ), providing breakfast to school children enhances their ability to concentrate and learn.
The TBF nutrition program offers breakfast in cooked porridge fortified with micronutrients. In 2014, approximately 41,000 children were served nationally, primarily in quintile 1 and 2 schools ( 16 ). The TBF feeding program, initiated in 2011, is designed to complement the NSNP meals. Volunteer food handlers (VFHs) are recruited to prepare and serve the breakfast meals. Breakfast is typically served between 7:30 am and 8:00 am, with each child provided with one plate and a set of eating utensils. Breakfast usually consists of fortified sorghum, maize, or oats-based porridge.
An assessment of the TBF program found that one of the factors contributing to its success is that the food provided is sufficient for school staff, garnering their support. Furthermore, this practice also encourages educators and staff to be punctual at school. Evaluators determined that the breakfast incentivizes children to arrive on time, resulting in the school starting promptly with most learners in attendance.
This study aimed to evaluate the menus utilized by school feeding programs and their impact on the health and well-being of children in South Africa.
2. Methods
This study constituted a cross-sectional survey conducted over two months, from April 2022 to May 2022, across four South African provinces including Gauteng, Western Cape, North West (NW), and KwaZulu-Natal (KZN). These provinces included breakfast and lunch as integral components of the National School Nutrition Programme (NSNP). The researchers employed a random selection process in each province to identify one district. Three schools were randomly selected from the district lists within each chosen district, with one selected from each eligible quintile. Within each selected school, interviews were conducted with at least one principal/coordinator, one teacher, and one food handler. A total of 36 individuals volunteered to participate in the study, as depicted in Table 1, which provides a breakdown per province.
| Province | Gauteng | Western Cape | North West | KwaZulu-Natal | Total |
|---|---|---|---|---|---|
| District | Johannesburg East | Cape Winelands | Bojanala | Uthukela | |
| Principals/Coordinators | 3 | 3 | 3 | 3 | 12 |
| Food handlers | 3 | 3 | 3 | 3 | 12 |
| Teachers | 3 | 3 | 3 | 3 | 12 |
| Total | 9 | 9 | 9 | 9 | 36 |
2.1. Instrumentation
The research design employed in this study embraced a mixed methods approach, encompassing both quantitative and qualitative research methods. The qualitative component was employed to gain an in-depth understanding of the perspectives of key stakeholders regarding the impact of in-school nutrition programs on the nutrition, health, and overall well-being of schoolchildren. Dietary intake data, encompassing energy, macronutrient, and micronutrient intakes (quantitative data), were assessed using the NutriSurvey application and the South African Food Composition table. These values were subsequently compared with reference intake values to determine the percentage contribution of school-fed diets to the children’s Recommended Dietary Allowances (RDAs) for ages 7-10 years.
This study utilized three distinct interview instruments: one for principals or NSNP coordinators, one for food handlers, and one for teachers. Additionally, a checklist was employed to evaluate the nutritional and health status of the children, as well as the hygiene conditions in the kitchen. The checklist’s design drew from past Department of Basic Education (DBE) reports, a comprehensive literature review, and the study’s objectives. The checklist encompassed the following sections: Nutrition evaluation, Assessment of the menu plan, Kitchen hygiene, and Health status of the schoolchildren. While the checklist remained consistent across all 36 schools, the open-ended questionnaires used for interviews with the principal, NSNP Coordinator, teacher, and food handler varied to accommodate their respective roles and responsibilities.
The survey instruments underwent a pilot phase at two schools in the Gauteng Province, involving six participants. These pilot schools were subsequently excluded from the main study.
2.2. Inclusion Criteria
- Public primary schools are falling within NSNP Quintiles 1-3.
- Participants included Principals, NSNP Coordinators, food handlers, and teachers.
- The study focused exclusively on four South African provinces including Western Cape, Gauteng, North West, and KwaZulu-Natal.
- Examination of NSNP lunch meals and TBF Breakfast meals only.
2.3. Exclusion Criteria
- High schools and private schools.
- Parents and schoolchildren.
2.4. Procedure
The study employed a random sampling technique to select districts and three schools per district, relying on the list provided by the TBF. School representatives were informed about the study through telephone communication. Once their acceptance was confirmed, dates for school visits were scheduled. Within each school, we approached at least one principal/coordinator, teacher, and food handler, conducting interviews with 36 volunteers who participated in the study (Table 1). Each interview had a duration of 15 to 20 minutes. A research assistant recorded the interviews while another completed the questionnaires. These interviews took place in the Principals’ offices, except for the Food handlers who were interviewed in the kitchen areas. Following the completion of the study, hard copies of the interview questionnaires were collected, and the recorded interviews were provided to a professional transcriber for transcription. Interviews conducted in KwaZulu-Natal were initially translated from Zulu to English before transcription. The transcribed digital copies were cross-referenced with the hard copy questionnaires, appropriately labeled, and subsequently analyzed using the Atlas. Ti software.
Regarding informed consent and data privacy, respondents were required to review and comprehend the study summary before commencing with the interviews and audio recordings. Subsequently, all participants signed an informed consent form attached to the survey instruments. Survey participants were assured that all data would be utilized exclusively for research and recommendations. Participants could include their names on the interview forms solely for tracking and follow-up purposes. Data was anonymized during the analysis phase and in the findings.
2.5. Ethical Approval
Ethical approval for the study was applied for and obtained from the University of Johannesburg, Faculty of Humanities Research Ethics Committee, with ethics number REC-01-029-2022. Permission to access the schools and conduct the study was sought from and granted by the Provincial Departments of Education in all four provinces. All ethical principles were followed. NSNP Coordinators, food handlers, teachers, and principals were fully informed of the nature and purpose of the study, as well as what their participation would involve.
2.6. Statistical Analysis
The interviews with Principals/Coordinators, teachers, and food handlers were transcribed and analyzed using ATLAS. Ti software version 22. The checklists were analyzed using Microsoft Excel 365, and descriptive statistics, such as charts and graphs, were used to report the results. The menu evaluation was conducted using the NutriSurvey application, and dietary intake data were generated and compared with RDA values. The NutriSurvey software also calculated the percentage of RDA met.
3. Results
3.1. Summary of the Socio-Economic Status of School Communities
Figure 1 displays the key characteristics of the school communities. The findings concerning the socio-economic status of the surveyed communities were derived from interviews. A prevalent issue across all the districts surveyed in the four provinces was a high rate of unemployment and a lack of food at home. Among the individual respondents, 84% were females (all VFHs and teachers sampled were females; only a few Principals/NSNP coordinators were males). All of them were adults over 30 years old and employed.
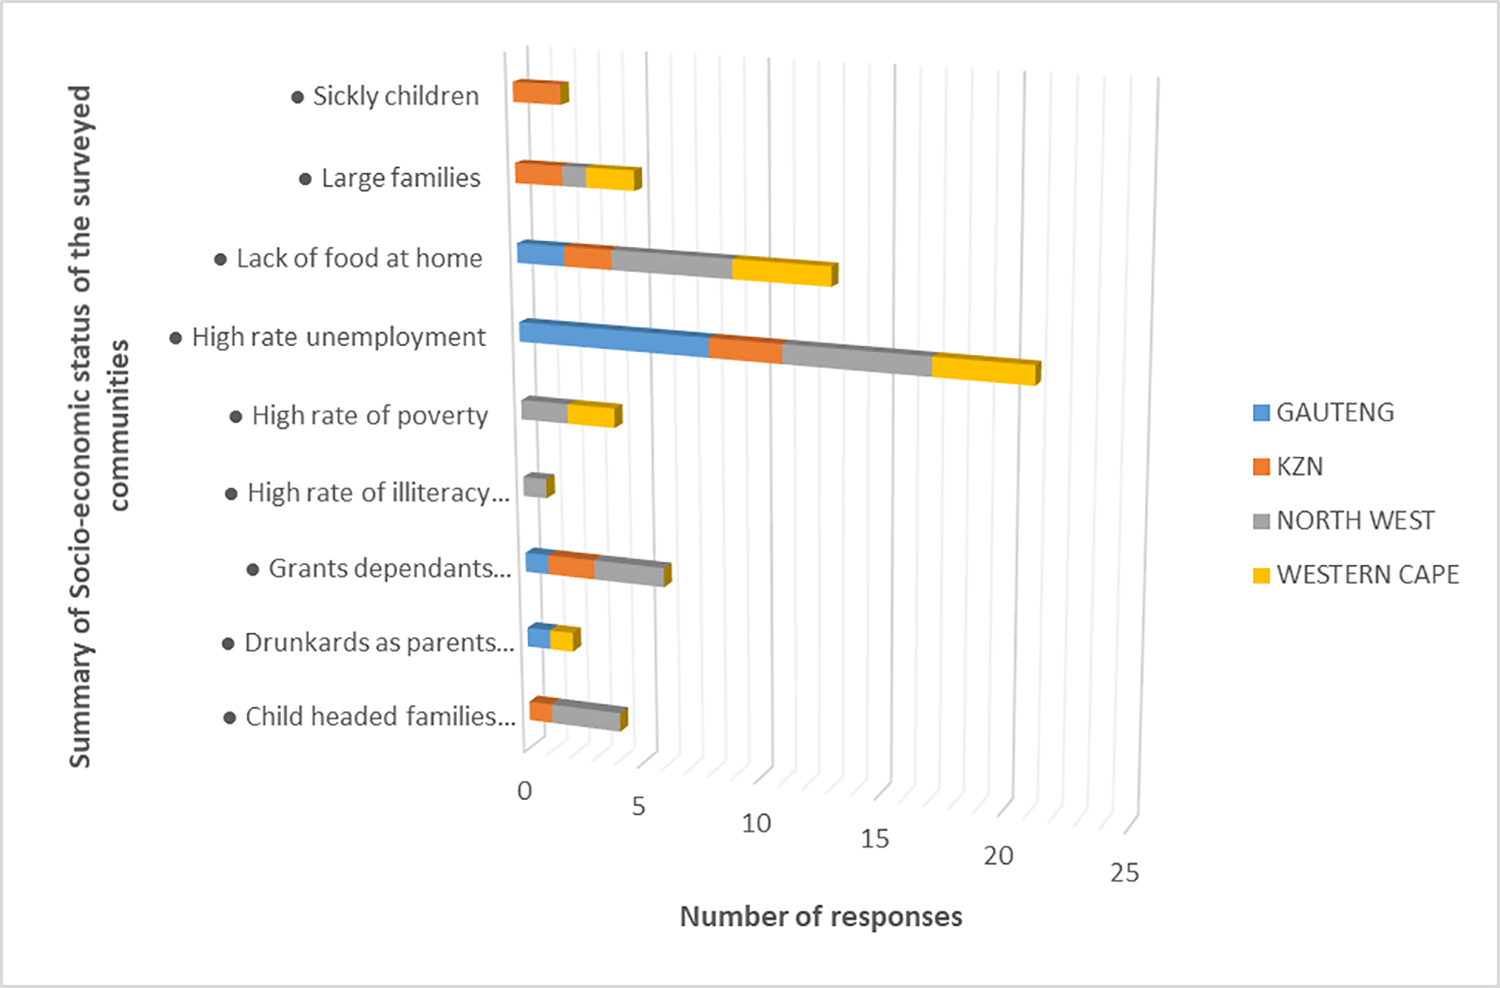
Figure 1.The figure shows the socio-economic status of the surveyed communities. KZN: KwaZulu-Natal.
The following observations were made:
1. High Unemployment: “The majority of our learners come from two hostels behind the school, and also from the informal settlements. And 90% of the parents are unemployed,” stated a principal in Gauteng.
2. Mostly Grant-Dependent: Most community members rely on government grants due to unemployment. “Most of them, almost all, depend on grants, and those working are employed in farms. However, most of them depend on grants,” reported one of the coordinators. Similarly, a principal from KZN also mentioned this dependence.
3. Large Household Size (Families): It was also observed that most families in the community are significant. A principal from the Western Cape stated, “Normally, you would find three to four. However, the worst case I encountered was seven kids with the mother, eight.”
4. Lack of Food at Home: Respondents from the four provinces expressed that most learners came from homes without sufficient food. “Some of our learners at home do not have something to eat. So normally they eat breakfast here at school, and they eat lunch,” mentioned a source from North West.
5. Parents Engaged in Alcoholism: One of the respondents complained that some parents “drink in such a way that you know sometimes they do not sleep at home,” as a principal in Gauteng reported. In the words of a coordinator from Western Cape, the learners’ “circumstances are terrible because of the abuse of alcohol by parents.”
6. Poor Health of Many Learners (Previously): It was observed that the living conditions of the learners made them sick and caused them to be absent from school before the commencement of the feeding programs. A coordinator from KZN noted, “The children were sick because of malnutrition and had rashes.”
3.2. Nutritional Value of Meals
In the following sections, we present the meals’ nutritional value and feedback from adult participants.
3.3. Nutritional Value of Provincial Menus and Percentage of RDA Met
The menu evaluation revealed that most NSNP lunch meals did not meet the desired 25-30% of the recommended daily allowance (RDA) for most essential nutrients, encompassing both micro and macronutrients. Only a select of few meals, such as chicken liver with rice (served on Tuesdays for lunch) in the Gauteng Province and pap with milk - Ace Instant (offered on Thursdays for lunch), appeared rich in essential nutrients. A nutrient breakdown for two sample meals is depicted in Tables 2 and 3. The first table elucidates the constituents of a Tuesday breakfast meal featuring Jungle oats, while the second table provides a nutrient analysis of the Thursday lunch menu for the Gauteng Province, comprising pap with milk and fruits. These two meals stand out as they seem to have the highest percentage values for RDAs met among the breakfast and lunch offerings, respectively.
| Food | Amount | Energy | Carbohydrate |
|---|---|---|---|
| Breakfast | |||
| Jungle oats | 35 g | 23.3 kcal | 3.4 g |
| UHT milk | 207 g | 129.6 kcal | 9.9 g |
| Sugar | 10 g | 40.6 kcal | 10.0 g |
| Drinking water | 200 g | 0.0 kcal | 0.0 g |
| Meal analysis: energy 193.5 Kcal, carbohydrate 23.3 g | |||
| Result | |||
| Nutrient content | Analyzed value | Recommended value/day | Percentage fulfillment |
| Energy | 193.5 kcal | 2036.3 kcal | 10% |
| Water | 412.0 g | 1800.0 g | 23% |
| Protein | 7.2 g (15%) | 60.1 g (12%) | 12% |
| Fat | 7.6 g (35%) | 69.1 g (<30%) | 11% |
| Carbohydrate | 23.3 g (49%) | 290.7 g (>55%) | 8% |
| Dietary fibre | 0.6 g | 25.0 g | 2% |
| Minerals | 1.5 g | - | - |
| Vit. A | 83.5 µg | 800.0 µg | 10% |
| Vit. D | 0.1 µg | 5.0 µg | 1% |
| Vit. E | 0.7 mg | 9.5 mg | 7% |
| Vit. B1 | 0.1 mg | 1.0 mg | 8% |
| Vit. B2 | 0.3 mg | 1.1 mg | 27% |
| Vit. B5 | 0.7 mg | 5.0 mg | 14% |
| Vit. B6 | 0.1 mg | 0.7 mg | 9% |
| Biotin | 4.8 µg | 17.5 µg | 28% |
| Total folic acid | 12.1 µg | 300.0 µg | 4% |
| Vit. B12 | 0.0 µg | 1.8 µg | 0% |
| Vit. C | 2.1 mg | 80.0 mg | 3% |
| Sodium | 104.1 mg | 2000.0 mg | 5% |
| Potassium | 324.4 mg | 1500.0 mg | 22% |
| Calcium | 255.1 mg | 900.0 mg | 28% |
| Magnesium | 18.7 mg | 170.0 mg | 11% |
| Phosphorus | 207.0 mg | 800.0 mg | 26% |
| Iron | 0.5 mg | 10.0 mg | 5% |
| Zinc | 1.2 mg | 7.0 mg | 17% |
| Copper | 0.1 mg | 1.3 mg | 9% |
| Manganese | 0.2 mg | 1.5 mg | 15% |
| PUFA | 0.4 g | 10.0 g | 4% |
| PUFA: Poly Unsaturated Fatty Acids | |||
| Food | Amount | Energy | Carbohydrate |
|---|---|---|---|
| Lunch | |||
| Ace Instant flavours | 40 g | 146.7 kcal | 31.2 g |
| UHT milk | 207 g | 129.6 kcal | 9.9 g |
| Table salt | 1 g | 0.0 kcal | 0.0 g |
| Orange fresh | 140 g | 65.9 kcal | 12.9 g |
| Drinking water | 200 g | 0.0 kcal | 0.0 g |
| Meal analysis: energy 342.2 Kcal, carbohydrate 54.0 g | |||
| Result | |||
| Nutrient Content | Analyzed value | Recommended value/day | Percentage fulfillment |
| Energy | 342.2 kcal | 2036.3 kcal | 17% |
| Water | 506.9 g | 1800.0 g | 28% |
| Protein | 10.0 g (13%) | 60.1 g (12%) | 17% |
| Fat | 7.3 g (20%) | 69.1 g (<30%) | 11% |
| Carbohydrate | 54.0 g (68%) | 290.7 g (>55%) | 19% |
| Dietary fiber | 4.0 g | 25.0 g | 16% |
| minerals | 3.3 g | - | - |
| Vit. A | 157.8 µg | 800.0 µg | 20% |
| Vit. D | 0.1 µg | 5.0 µg | 1% |
| Vit. E | 0.3 mg | 9.5 mg | 4% |
| Vit. B1 | 0.2 mg | 1.0 mg | 23% |
| Vit. B2 | 0.4 mg | 1.1 mg | 39% |
| niacine | 1.6 mg | 6.0 mg | 27% |
| Vit. B5 | 1.3 mg | 5.0 mg | 26% |
| Vit. B6 | 0.2 mg | 0.7 mg | 35% |
| Biotin | 8.5 µg | 17.5 µg | 49% |
| Total folic acid | 67.9 µg | 300.0 µg | 23% |
| Vit. B12 | 0.0 µg | 1.8 µg | 0% |
| Vit. C | 78.1 mg | 80.0 mg | 98% |
| Sodium | 570.5 mg | 2000.0 mg | 29% |
| Potassium | 552.1 mg | 1500.0 mg | 37% |
| Calcium | 391.5 mg | 900.0 mg | 43% |
| Magnesium | 31.1 mg | 170.0 mg | 18% |
| Phosphorus | 213.8 mg | 800.0 mg | 27% |
| Iron | 1.9 mg | 10.0 mg | 19% |
| Zinc | 1.8 mg | 7.0 mg | 26% |
| Copper | 0.2 mg | 1.3 mg | 15% |
| Manganese | 0.1 mg | 1.5 mg | 4% |
| PUFA | 0.3 g | 10.0 g | 3% |
| PUFA: Poly Unsaturated Fatty Acids | |||
3.4. Menu Evaluation
Calculations for the mean percentage of RDAs met demonstrate that for the TBF breakfast, among the essential nutrients for child nutrition, the least mean percentage met was 2% for Poly Unsaturated Fatty Acids (PUFAs), while the maximum met was 21% for calcium. Compared to menus from other provinces, the Gauteng lunch appeared to exceed the met percentages for most essential nutrients. The results of the school feeding evaluation indicated that schools adhere to the designated menus for each province, although there may be slight variations in the quantities served. The TBF breakfast typically provides between 10-20% of the RDAs. Figure 2 illustrates a graphical representation.
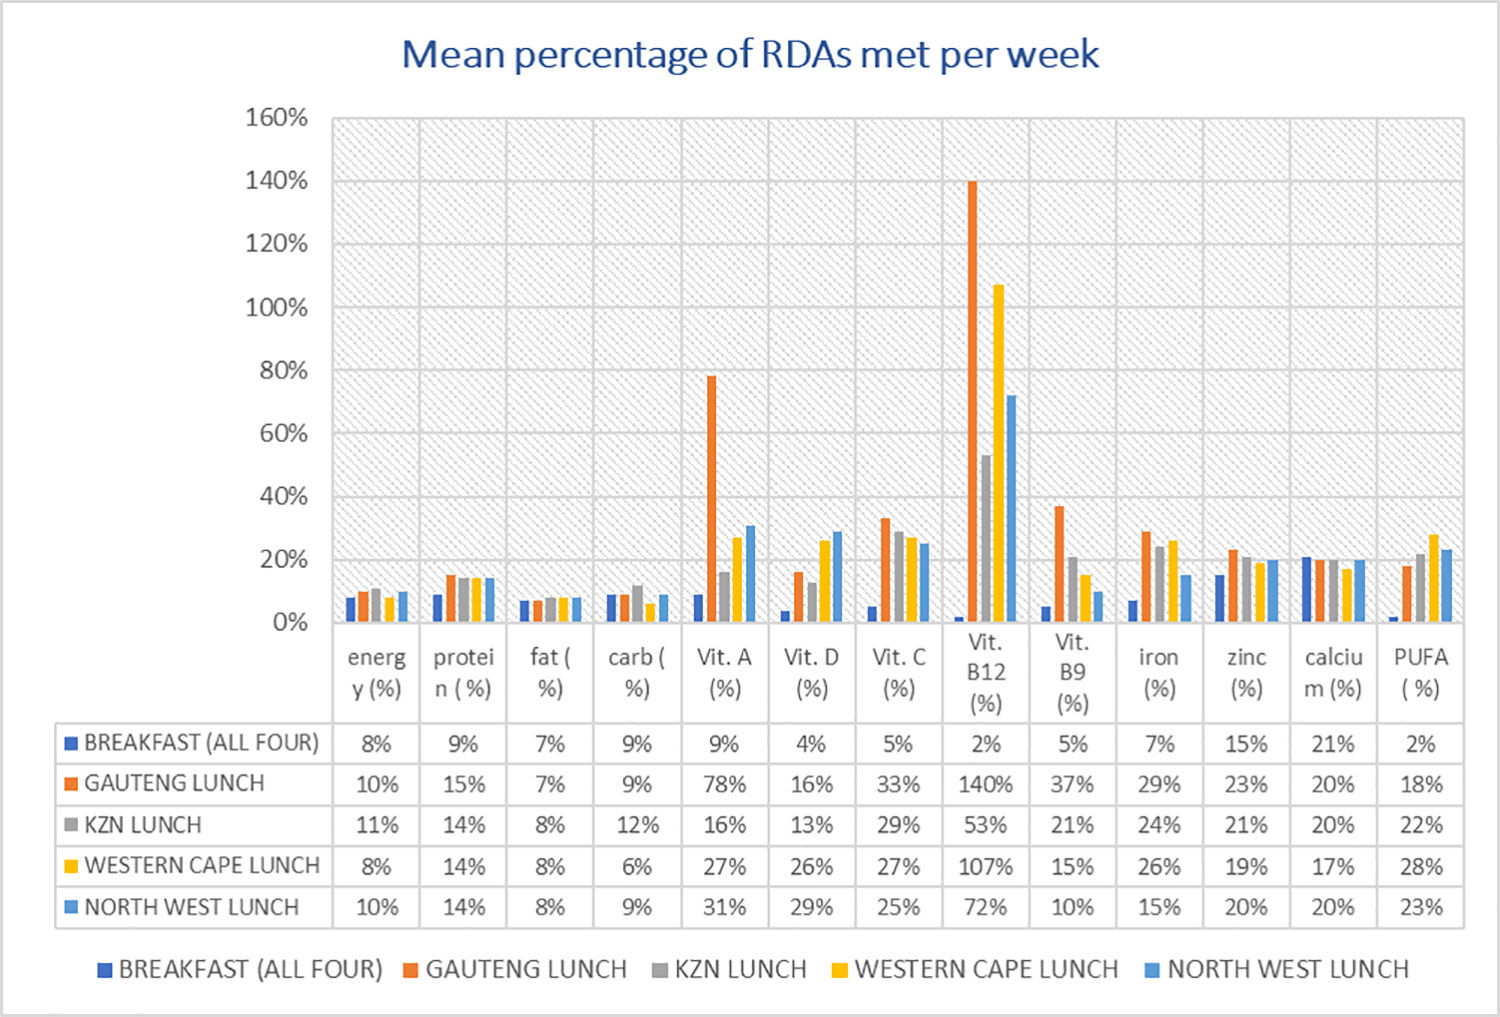
Figure 2. The figure shows the graphic representation of the average RDAs met per week for different provinces. RDAs: Recommended Dietary Allowances, KZN: KwaZulu-Natal.
3.5. Feedback from Interviewees/Stakeholders on School Feeding Programs
The interviews revealed that the school feeding programs have substantially benefited the schools and their respective communities. Interviewees affirmed that school feeding has improved attendance, punctuality, and heightened student alertness during class. Some school teachers also reported noticing academic improvements in some instances. Based on observations and reports from interviewees, fruits are not regularly served to the children, and when they are, there is a lack of variety. For instance, children become easily bored when offered the same fruit, such as oranges, repetitively.
3.6. Impact of School Feeding on Academic Performance
Respondents also emphasized the significant impact of the feeding programs on students’ academic performance. These programs enhance academic achievement in two primary ways: 1) by increasing access to and participation in school, serving as an incentive for children to attend, and 2) by improving the nutritional intake of school children. Schools represent excellent venues for health and education interventions due to the high attendance rates. As noted by respondents, these programs have improved students’ concentration in class. A teacher from Gauteng commented that learners “perform well because they concentrate thanks to this feeding scheme.” Another teacher from North West added, “Most of the learners are performing very well; you cannot listen to the teacher with an empty stomach.”
The level of learners’ concentration has directly impacted their overall academic performance. One principal asserted, “They are doing remarkably well, and we have won many trophies. We participate in every competition; not long ago, we excelled in a spelling bee competition (a principal in KZN). Figure 3 indicate visual representation of the impact of school feeding on academic performance.
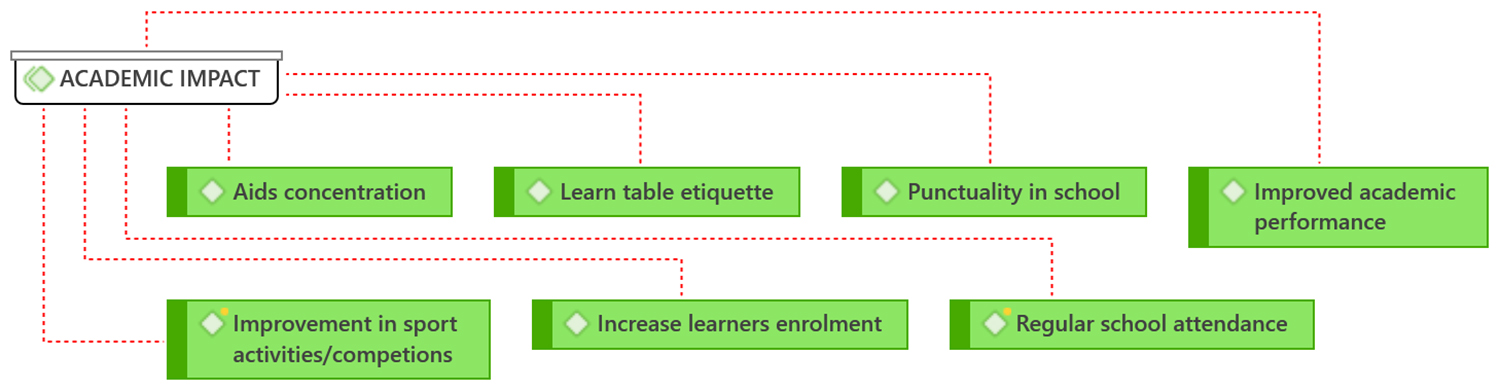
Figure 3. The figure shows the impact of school feeding on academic performance.
3.7. Improved School Attendance and Punctuality
Furthermore, respondents noted that school feeding has significantly improved attendance and reduced tardiness. A food handler in Gauteng mentioned, “It has made much difference because since we started this feeding scheme, we no longer have kids absent from school due to sickness.” A principal from KZN also confirmed that the feeding programs have helped immensely with absenteeism, stating, “It has minimized late arrivals and absenteeism because they know that if they come late, they will not get breakfast.” Similarly, a coordinator from the North West asserted, “It has reduced late arrivals and absenteeism because they understand that arriving late means missing out on breakfast.”
3.8. The Well-being of School-fed Learners
Figure 4 illustrates that 100% of the responses were positive regarding the impact of school-feeding programs on school-fed children’s nutritional and health status. The only negative responses (25%) regarding food not satisfying the children were recorded in KwaZulu-Natal.
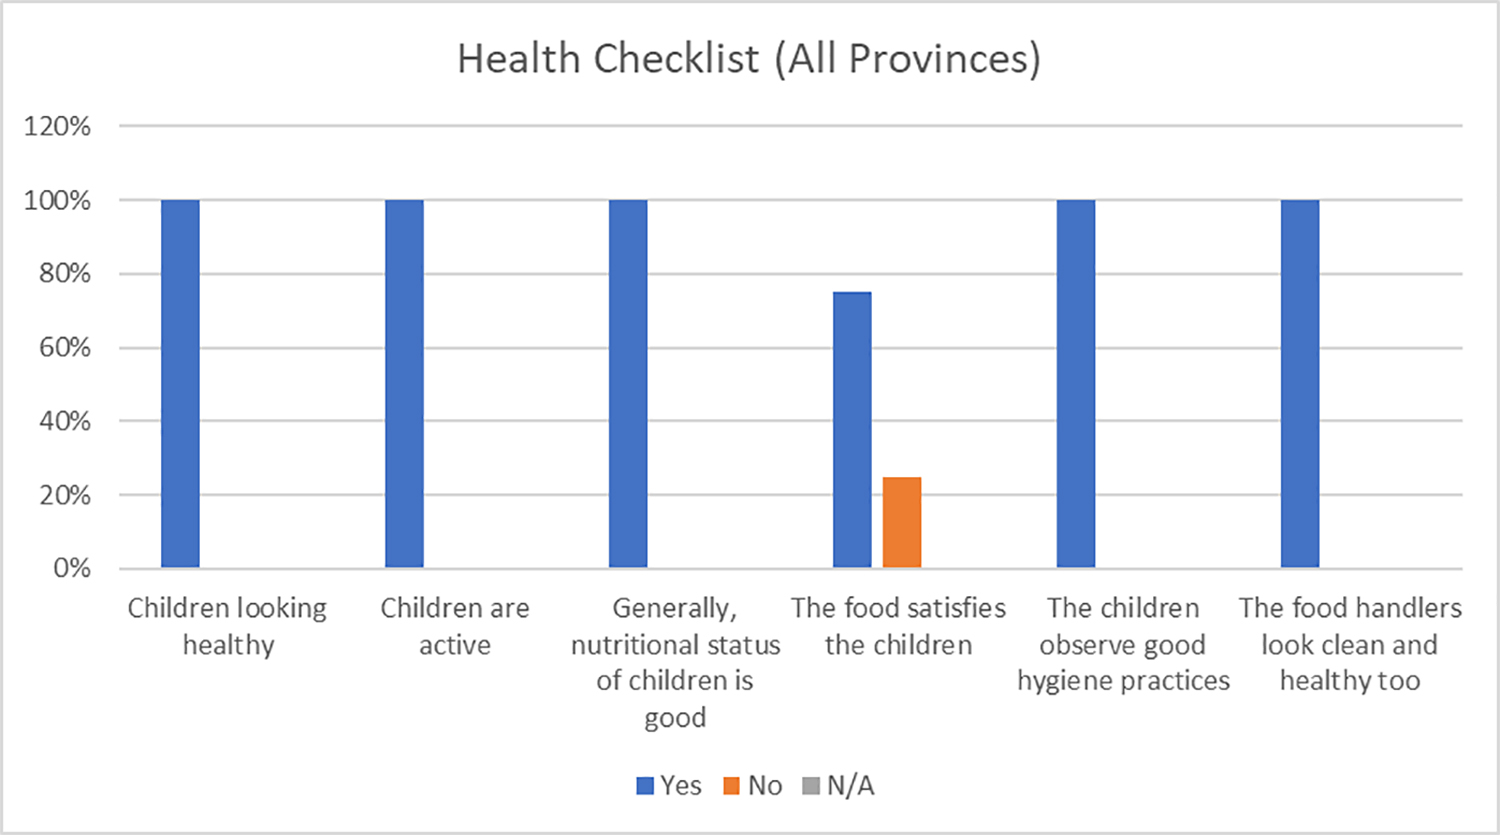
Figure 4. The figure shows the interviewees’ responses on learners’ nutrition and wellbeing.
4. Discussion
The results indicated that most NSNP lunch meals did not meet the 25-30% benchmark per meal of the children’s Recommended Dietary Allowances (RDAs). The TBF breakfasts provided 10-20% of the RDAs, significantly augmenting the NSNP meals. Menus must be developed in consultation with dietitians and nutritionists, considering indigenous preferences, cultural practices, and habits ( 16 ). Bundy and co-workers ( 17 ) recommended that the energy content of meals should be based on the duration of the school day. For instance, if children attend school for about half a day, the meals should provide 30 - 45% of the children’s energy requirements. They also advised that school meals should incorporate fortified ingredients to ensure the provision of adequate micronutrients. The NSNP menus are formulated by Provincial Education Departments (PEDs) in collaboration with the Department of Health (DoH) and are approved by the Department of Basic Education (DBE) ( 18 ). These menus undergo annual review to supply up to 33% of the RDA for energy requirements for children aged 7-10 years ( 19 ). The menus specify the type and quantity of food to be prepared daily. However, an evaluation of the NSNP menus conducted by Rendall-Mkosi and colleagues ( 20 ) found that, regarding nutritional value, the NSNP meals generally provided only about 15% of the RDA for energy and 26% of protein requirements. When children come to school hungry, providing them with breakfast is beneficial. Kristjansson and colleagues ( 16 ) noted that skipping breakfast is particularly challenging for undernourished children. Bundy and co-workers ( 17 ) recommended that if short-term hunger is an issue, the school meal should be provided in the morning when children arrive, as this can positively impact their ability to concentrate and learn.
The Gauteng lunch menu appears to have a higher percentage of RDAs met for most essential nutrients when compared to menus from other provinces. A previous report ( 6 ) from 2013 indicated that the NSNP was meeting between 15-26% of the RDAs, which aligns with the results of this study (10-27%), except for vitamin B12, which had mean percentage values above 50%.
The findings of this study revealed that only the mean percentage of RDAs met for vitamins B12 and A reached the desired 25-30% target set by the NSNP for each meal. These findings are consistent with the results of a previous evaluation of in-school nutrition conducted in 2013 by Rendall-Mkosi and colleagues ( 20 ). In that DPME/DBE report ( 6 ), low percentages of RDAs met were noted (e.g., protein 18%, energy 15%, and vitamin A 2%), leading to a recommendation for an increase in the quantity and quality of meals provided to learners. It is well-established that malnutrition has severe and adverse consequences for children. Micronutrient deficiency, also known as ‘hidden hunger,’ is especially insidious when it involves sufficient energy intake (calories/kilojoules) but insufficient micronutrients. Additionally, children experiencing undernutrition alongside excessive kilojoule consumption may become susceptible to obesity in adulthood ( 21 ), and obesity carries serious health risks. South Africa faces a “double burden” of nutrition-related health problems, encompassing undernutrition and overnutrition (obesity), often within the same household ( 22 ).
The analysis of the health checklist in this study revealed that, overall, the children were healthy, and the food handlers followed good hygiene practices in the four provinces surveyed. Consequently, positive outcomes have been observed regarding the health of the school children, as well as improvements in school attendance, punctuality, and academic performance. These findings align with the results of previous research ( 6 ).
It is well-established that adequate nutrition yields positive health outcomes and vice versa. Continuous provision of nutritious food to learners in recommended quantities and good healthcare will ensure their healthy growth and development.
4.1. Recommendations to Stakeholders
The following recommendations are provided to facilitate the enhancement of in-school nutrition menus and, consequently, to improve the overall health outcomes for children:
1. Increase Fresh Fruits Supply: Incorporate fresh fruits into the menus, as fruits were only provided infrequently (typically once weekly).
2. Incorporate Meat and Eggs: Consider adding meat or eggs to the menus, as this will augment protein intake and contribute to meeting the recommended dietary allowances (RDAs).
3. Adjust Serving Sizes: It is essential to increase the portion sizes to align with the target of 25-30% of the RDAs per meal, particularly in KwaZulu-Natal. Standardizing portion sizes and recipes is recommended.
4. Improve Kitchen and Storage Facilities: Some schools require larger kitchen spaces and better storage facilities, including refrigeration, to minimize food waste and ensure the consumption of safe foods.
5. Revive School Gardens: Reinitiating school gardens can help provide a sustainable source of fresh herbs, fruits, and vegetables, as they proved beneficial in the past.
6. Maintain Menu Consistency: Schools should adhere to the provided menus whenever possible and ensure a diverse range of foods is offered to students.
7. Enhance Volunteer Food Handlers Training: Further training for Volunteer Food Handlers (VFHs) should encompass portion control, food preparation skills, basic nutrition knowledge, and hygiene and safety practices. Implementing these measures will enhance the quantity and quality of school food.
4.2. Limitation
It is essential to acknowledge the limitations of this study. Due to limited funding, the research could only be conducted in four of the nine South African provinces. Future studies should aim to survey more schools in various districts, and a longitudinal study is recommended to scientifically validate the impact of school feeding on learners’ academic performance by the claims made by principals and school teachers.
5. Conclusion
The findings indicated that most NSNP lunch meals did not meet the 25-30% benchmark of children’s RDAs per meal. The TBF breakfasts, providing between 10-20% of the RDAs, significantly supplement the NSNP meals. Some meals met a few micronutrient RDAs, including B vitamins, vitamin A, and calcium. However, there was a lack of frequent fruit consumption among children.
Despite these nutritional challenges, the children generally exhibited good health, and adult stakeholders reported positive effects of school feeding programs on school attendance, punctuality, classroom attention, and academic performance. Therefore, the continuation of in-school nutrition programs, distribution of food parcels, and promotion of social protection grants should be encouraged, as they play a crucial role in mitigating child malnutrition and improving the overall well-being and academic performance of schoolchildren, even in the face of the current global economic challenges.
Acknowledgement
The authors would like to acknowledge the Tigerbrands Foundation and the Centre for Social Development in Africa (CSDA), Food Evolution Research Laboratory Fieldworkers, University of Johannesburg, for their support and immense contribution to the success of this study.
Authors’ Contribution
Hema Kesa: Substantial contributions to the conception of the work, analysis of data for the work, drafting the work and reviewing it critically for important intellectual content. Eridiong Onyenweaku: Analysis of data for the work, drafting the work and reviewing it critically for important intellectual content. All authors have read and approved the final manuscript and agree to be accountable for all aspects of the work, such that the questions related to the accuracy or integrity of any part of the work.
Funding
This research project was funded by the Tiger Brands Foundation.
Ethical Approval
Ethical approval for the study was applied for and obtained from the University of Johannesburg, Faculty of Humanities Research Ethics Committee. Permission to access the schools and conduct the study was sought from and granted by the Provincial Departments of Education in all four provinces. Also, written informed consent was obtained from the participants.
Conflict of Interest
None declared.
References
- UNICEF, WHO, World Bank. Levels And Trends Child Malnutrition: Key Findings of The 2020 Edition of the Joint Child Malnutrition Estimate. Geneva WHO. 2020; 24(2):1-16.
- Lake L, Shung-King M, Delany A, Hendricks MK. CHILDREN AND COVID-19 ADVOCACY BRIEF Prioritise children - from response to recovery; 2021.
- WHO. Technical paper Regional strategy on nutrition 2010 – 2019. Development; 2010.
- Dorward A, Guenther B, Sabates-Wheeler R. Linking Social Protection and Support to Small Farmer Development. FAO; 2008.
- Wenhold F, Kruger S, Muehlhoff E. Nutrition for school-age children and adolescents. In Steyn NP, Temple N, editors. Community nutrition textbook for South Africa – A rights-based approach; 2007.
- DPME/DBE. Report on the Implementation Evaluation of the National School Nutrition Programme: Full Report; 2016.
- Maluleke T, Shisana O, Labadarios D, Rehle T, Simbayi L, Zuma KK, et al. South African National Health and Nutrition Examination Survey (SANHANES-1). HSRC Press; 2021.
- Tomlinson M. School feeding in east and southern Africa : Improving food sovereignty or photo opportunity ? Regional Network for Equity in Health in Southern Africa. Syst Res. 2007; 46
- UNICEF. Undernutrition contributes to half of all deaths in children under 5 and is widespread in Asia and Africa, 2015. Available from: http://data.unicef.org/nutrition/malnutrition
- Hendricks MK, Goeiman H, Hawkridge A. Promoting health growth: Strengthening nutritional support for mothers, infants and children. In Berry L, Biersteker L, Dawes A, Lake L, Smith C, editors. South African Child gauge; 2013.
- Bhutta ZA, Das JK, Rizvi A, Gaffey MF, Walker N, Horton S, et al. Evidence-based interventions for improvement of maternal and child nutrition: What can be done and at what cost? Lancet. 2013; 9890:452-477. DOI | PubMed
- Walker SP, Wachs TD, Grantham-McGregor S, Black M, Nelson CA, Huffman SL, et al. Inequality in early childhood: Risk and protective factors for early child development. Lancet. 2011; 378(9799):1325-38. DOI | PubMed
- Desai A, Smith LE, Mbuya MN, Chigumira A, Fundira D, Tavengwa NV, et al. The shine trial infant feeding intervention: Pilot study of effects on maternal learning and infant diet quality in rural Zimbabwe. Clinical Infectious Diseases. 2015; 61:S710-S715. DOI
- Umeokonkwo AA, Ibekwe MU, Umeokonkwo CD, Okike CO, Ezeanosike OB, Ibe BC. Nutritional status of school age children in Abakaliki metropolis, Ebonyi State, Nigeria. BMC Pediatr. 2020; 20(1):114. Publisher Full Text | DOI | PubMed [ PMC Free Article ]
- May J, Witten C, Lake L, Skelton A. The slow violence of malnutrition. In May J, Witten C, Lake L, editors. South African Child Gauge; 2020.
- Kristjansson EA, Gelli A, Welch V, Greenhalgh T, Liberato S, Francis D, et al. Costs, and cost-outcome of school feeding programmes and feeding programmes for young children. Evidence and recommendations. International Journal of Educational Development. 2016; 48(C):79-83. DOI
- Bundy D, Burbano C, Grosh ME, Gelli A, Juke M, Lesley D. Rethinking school feeding; 2009.DOI
- Graham L, Hochfeld T, Stuart L, Van Gent M. Evaluation study of the National School Nutrition Programme and the Tiger Brands Foundation in-school breakfast feeding programme in the Lady Frere and Qumbu districts of the Eastern Cape. Johannesburg; 2015.
- Department of Basic Education. National guidelines for the implementation, monitoring, and reporting on the national school nutrition programme. Pretoria; 2010.
- Rendall-Mkosi R, Wenhold F, Sibanda NB. Case study of the National School Nutrition Programme in South Africa. Pretoria; 2013.
- Scientific Advisory Panel, Healthy active kids: South Africa report card; 2014. Available from: https://www.vitalityschools.co.za/schools/educationaltools/research.do
- Vorster H. Revised food-based dietary guidelines for South Africa: Challenges pertaining to their testing, implementation and evaluation. South African Journal of Clinical Nutrition. 2013; 26:S3-S4.


