
1. Introduction
There are numerous factors that impact the learning of students in school, including their physical and mental health, which is directly affected by the school’s environment. One crucial factor is the thermal dimension, often called thermal health or thermal comfort, assessed through thermal analysis ( 1 ). Research underscored the significance of thermal comfort in students’ learning and health ( 2 , 3 ). Also, research investigating thermal comfort in schools indicated discomfort conditions ( 4 ). For instance, a study examining female students found that thermal comfort impacted their mental health ( 5 ).
The equilibrium between the body’s surface and the surrounding environment influences physiology, psychology, and behavior, resulting in human thermal health ( 6 ). Thermal analysis gauges an individual’s environmental satisfaction and encompasses indoor and outdoor spaces. Studies have been conducted on indoor thermal heath ( 7 ), but there have not been as many investigation into thermal health in outdoor spaces while thermal health is necessary for people to be present in open spaces ( 8 ). The present study investigated thermal analysis in open spaces of schools to improve students’ thermal health. The external thermal analysis involves several indicators grouped into physiological (PET, SET*) and mental (PMV, PPD) categories. Additionally, during summer, Mean Radiant Temperature (TMRT) is a critical meteorological parameter for human thermal sensation under sunlight ( 9 ). SVF is a metric used to measure the amount of visible sky from a specific location in an open space. It plays a crucial role in understanding the quality of open spaces and their potential for natural light, ventilation, overall urban comfort and thermal health. SVF has also a direct impact on TMRT.
SVF significantly impacts thermal analysis and has applications in urban planning ( 10 ), forests, biometeorology, and more ( 11 ). It plays a significant role in thermal phenomena modeling, such as the urban heat island ( 12 ) in urban planning ( 13 ). Previous studies established a correlation between air temperature and SVF ( 14 ). Moreover, research showed that shade effectively improves environmental thermal comfort ( 15 ) by reducing solar radiation during hot seasons ( 16 ). However, a comprehensive examination of the correlation between thermal health and SVF in the open spaces of schools is yet to be conducted. Therefore, the present study investigated the impact of SVF on students’ thermal health. The study considered two areas: physical health (SET* and PET models) based on ASHRAE55 and ISO7730 standards; and mental health (PMV and PPD models) using Fanger’s equation. To do so, two stations were identified in the courtyards of three secondary schools in District 1, Shiraz, Iran. The SVF index of each station was determined using spherical photography. Thermal health was determined using RayMan version 1.2 software. The influential physiological and mental health indicators factors were gathered using SVF.
1.1. Theoretical background
This study was based on two scientific categories: SVF and thermal analysis, aiming to enhance students’ thermal health in school open spaces.
1.1.1. Thermal Health: Thermal health can only be maintained when the heat produced by metabolism equals the heat lost from the body ( 17 ). Definitions and effective parameters of thermal health are gathered to provide thermal comfort for humans ( 18 ); the effective parameters are Air temperature (Ta), Humidity, Wind speed, Mean Radiant Temperature (MRT), Metabolic rate (activity level), and Clothing Insulation ( 19 , 20 ). Among these, TMRT has the most impact on thermal health by designers ( 21 ). The calculation of thermal health inside ( 22 ) and outside ( 23 ) has been presented with various methods (24) which can be divided into two groups: experimental (ET, RT, HOP, OP, WCI) and analytical (PET, PT, PMV, PPD, OUT-SE, SET, HIS, ITS) ( 25 ).
1.1.2. Thermal Health Standards: Several institutions have compiled standards, the most reliable of which are ISO and ASHRAE international standards. ISO 7730 standard uses Fanger’s model of thermal comfort ( 17 ). ISO DIS 10551 describes the fundamental issues of thermal health. Also, ISO 8996 provides the rate of metabolism, and ISO 9920 is concerned with the effects of clothing and covering. ASHRAE Model, 2005, is used for people wearing regular winter clothes. Finger’s formula software and ASHRAE55 standard were used in this study.
1.1.3. Thermal Health from the Physical Aspect (PET, SET): The human body keeps its temperature at a constant level by controlling the amount of metabolism and evaporation (such as sweating and shivering). Meanwhile, the body’s heat exchange with the environment is only through transmission, conduction, and radiation, which cannot be controlled. Therefore, the effective temperature is a combined parameter of the effects of air temperature, radiation temperature, and wind. The effective temperature (ET) is used in many thermal comfort software ( 26 ). In this regard, two outdoor thermal comforts have been defined based on weather indices:
SET: Effective air temperature from a hypothetical standard environment with a relative humidity of 50% and with standard clothing coverage for related activities, which has similar overall temperature changes from the skin surface temperature in natural environments ( 27 ).
PET: It results from the human body’s energy balance, and is suitable for evaluating thermal components in different climates, and has a precise physiological basis. Experts often use PET to analyze the thermal physiological behavior of users.
1.1.4. Thermal Health from the Mental Aspect (PMV-PPD): The desired qualities can be analyzed using the governing mathematical rules by quantifying the quality parameters. To do so, in Fanger’s model ( 17 ), PMV and PPD are defined for mental thermal health.
PMV: It defines the average vote of a large group with a 7-point scale that was converted into a PMV equation by Fanger in 1972 ( 17 ). PMV turned the influence of six main variables (activity level, insulation of clothing type, air temperature, airspeed, relative humidity, and average radiant temperature) on the thermal health level ( 28 ).
PPD: It is not an independent index. Its value can be calculated from PMV. This index calculates the number of people who feel cold or hot.
1.1.5. SVF: It is the influential variable in thermal analysis that expresses the amount of radiation received on a flat surface from the hemisphere surface, including the surface; SVF (ψs) value is between 0 to 1 ( 29 ).
There are several ways to measure SVF, which includes analogical comparison and spherical photography models. The analytical calculation involving the measurement of angles based on length and width, calculation programs, similar computerization is the use of global positioning system signals and geographic information systems, as well as geometric calculations in the urban space ( 30 , 31 ). Due to the ease of calculations when using environmental elements such as trees, spherical photography is the fastest and most accurate method ( 32 ).
2. Method
In this study, a quantitative structural research method was used.
2.1. The Spatial Scope of the Research: Shiraz, located in the southern region of Iran, is the largest city with a semi-warm and dry climate, situated at latitude 29° 57 and longitude 53° 38 ( 33 ). The city is divided into 11 municipal districts and 4 educational system districts. Among the schools in the first education district, there are 26 first-secondary girls’ schools. Based on the presence of green spaces, large and old trees in the schoolyards, and the comparable sub-climate of these yards, three schools, namely Sharif Ashraf, Vali Asr, and Pardis, all of which were constructed at least 20 years ago, were selected using a systematic selection method (Figure 1a). As the final scope of the present study, six stations were chosen in 3 schools (Figure 1b).
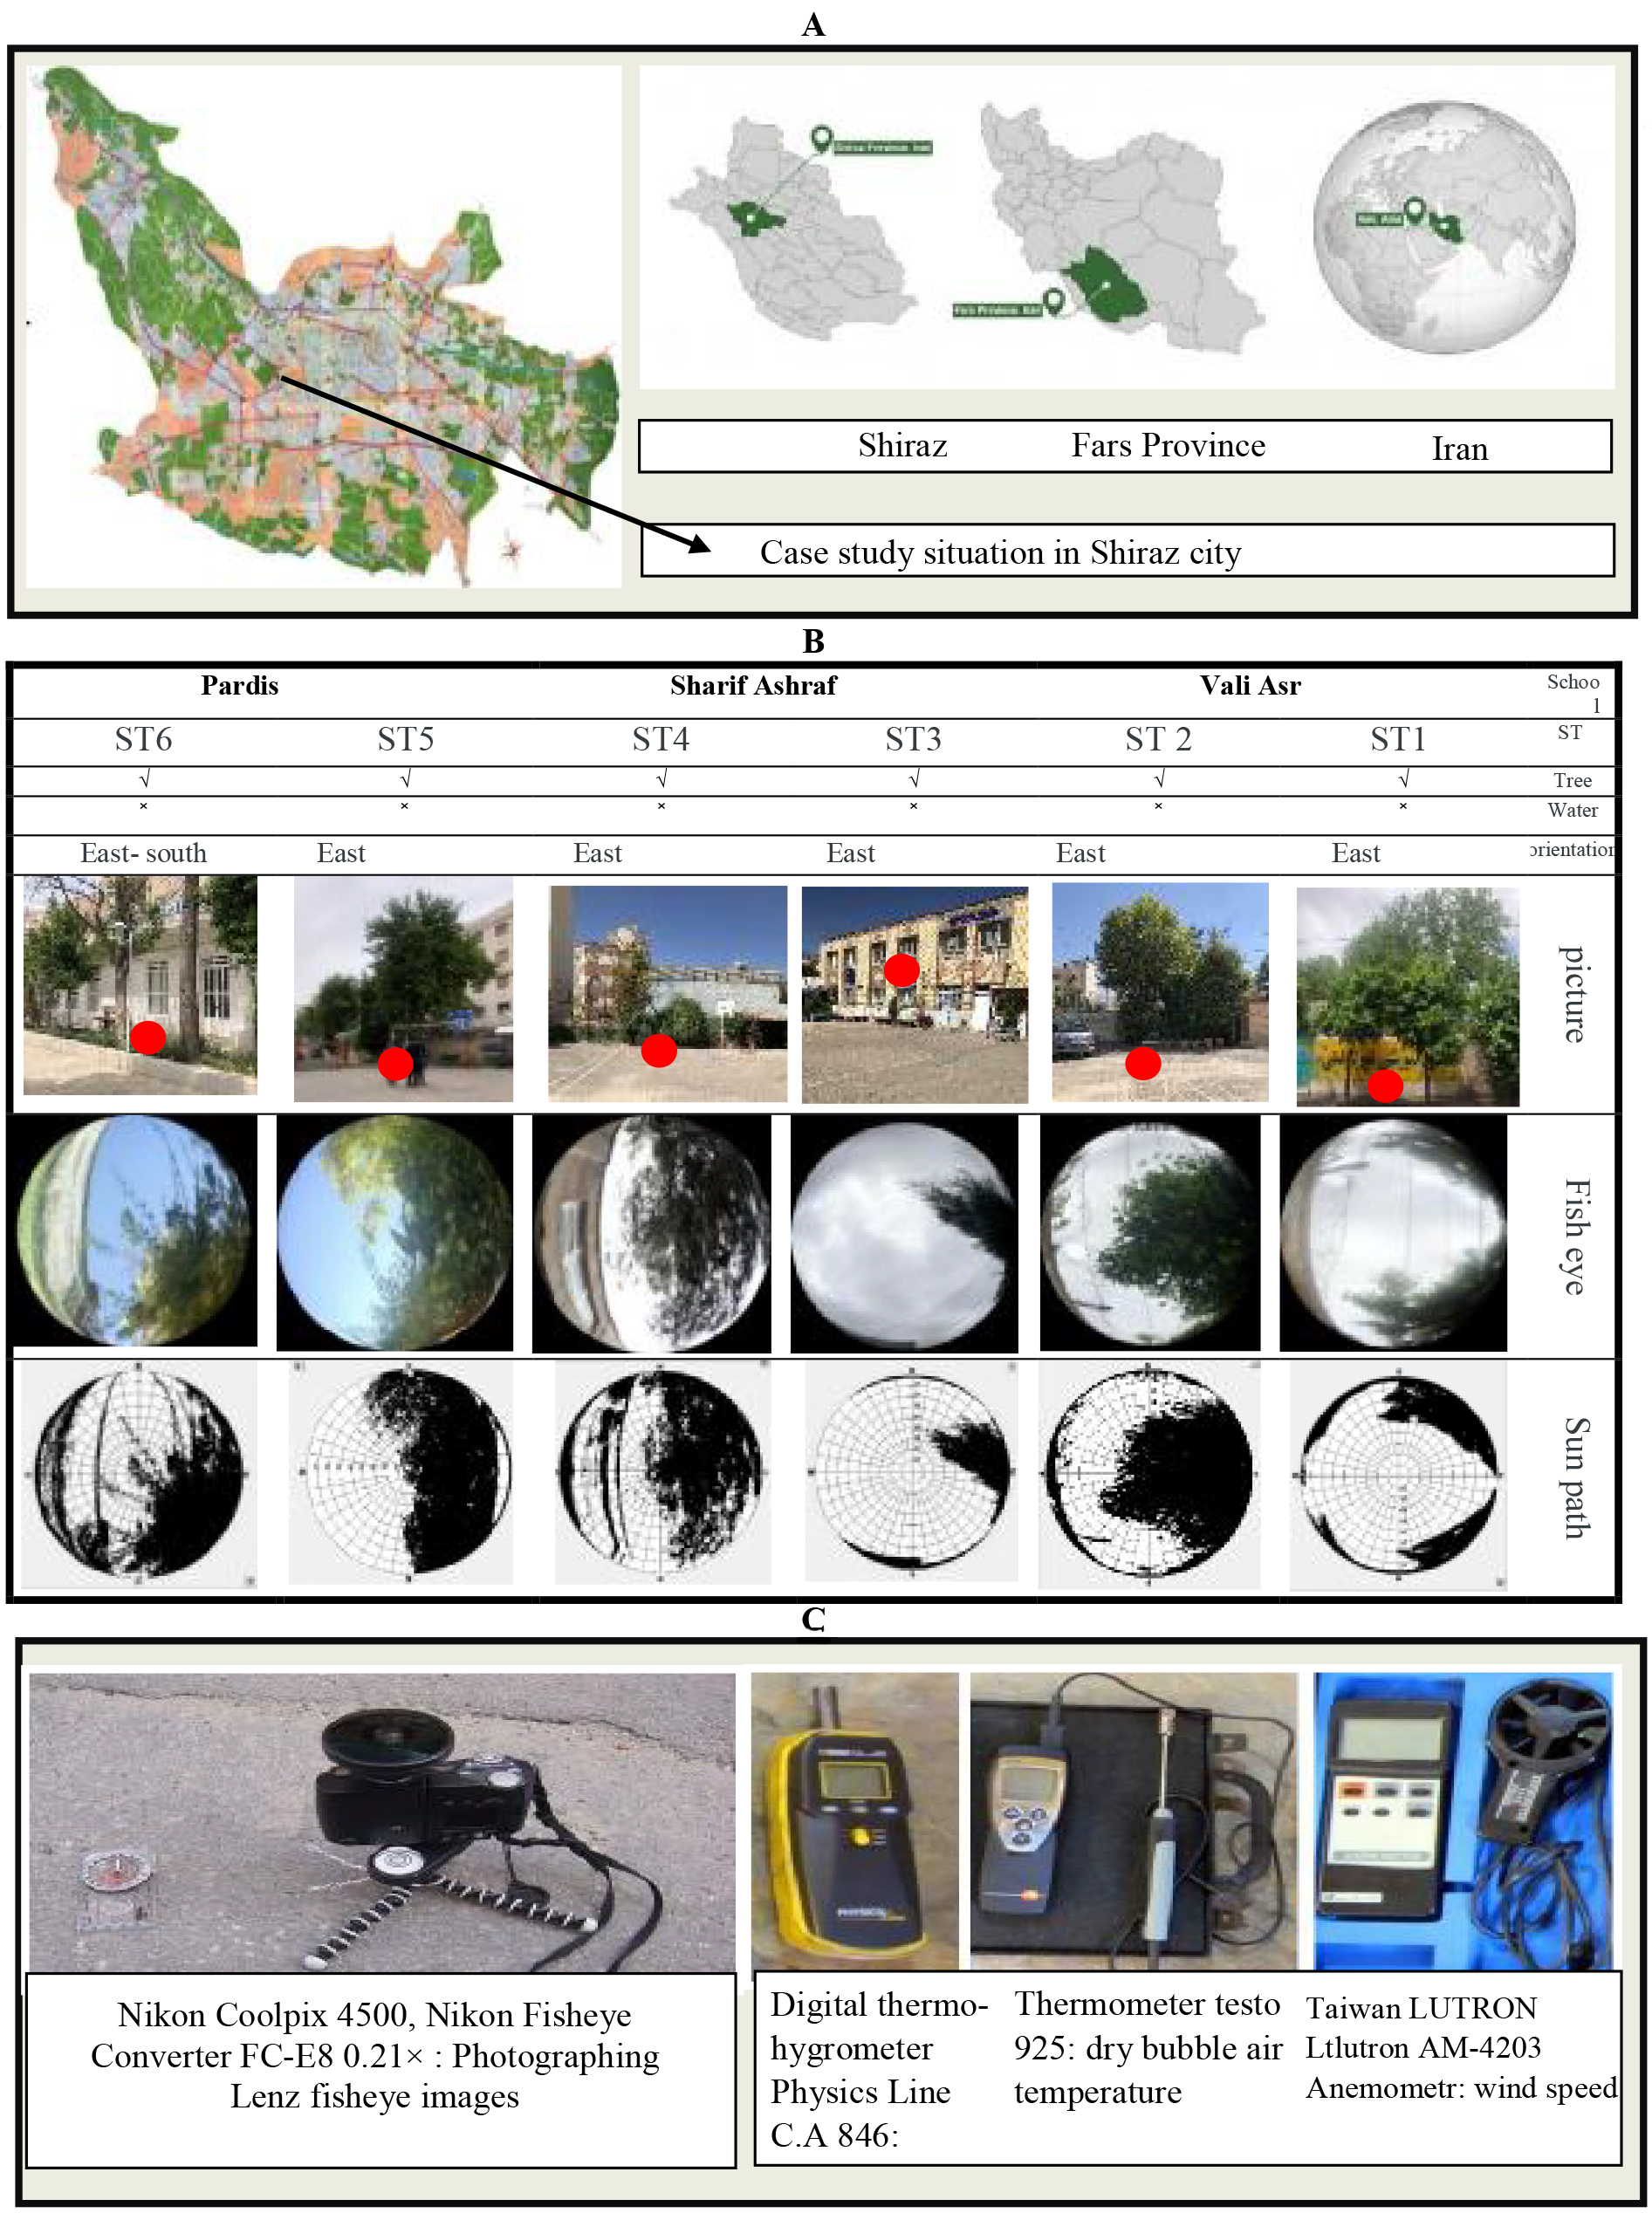
Figure 1. The figure shows the schools location and the data logger used in the research. A: The location of three secondary girls’ schools in Shiraz, source. B: The location of the bench in school yards and spherical images. C: The data logger used in the research
2.2. Data: The study involved two categories of data: input and output.
Input Data: The input data were gathered through four methods: measurement, simulation, photography, and studies (Figure 1c).
Output Data: Parameters affecting thermal analysis were recorded in two parts: health physics using the Reyman model ( 34 ) (PET, SET) and mental health (PMV, PPD), calculated with Fanger’s formula ( 17 ).
2.3. Time Frame of the study: According to the report of Meteorological Organization, the average air temperature during the hot season, from May to September 2022, exceeds the thermal comfort range ( 35 ). Hence, the study period was chosen to be the first day of April, May, and June 2022, aligning with school activities in the hot season. Given the time spent in the schoolyard and hours of unfavorable sunlight, 11 A.M. was selected as the study time.
2.4. Measurement and Calculation Method
A- Health Physics Analysis: first, the spherical images were converted to SUN Path images, and SVF values were determined using Reyman software. Then, physical health (PET, SET) was calculated with the meteorological data.
B- Mental Health: PMV was calculated using the Fanger’s formula ( 17 ), and based on PMV, another Fanger’s formula was used to determine PPD. The output data were divided into SVF, physical (PET, SET*), and mental (PMV, PPD) health values.
2.5. Data Analysis Method: The data was analyzed using SPSS version 26. A correlation graph between SVF and thermal health was plotted, and the effectiveness coefficient of each parameter was calculated. Furthermore, outliers and data dispersion and their causes were explained (Figure 2).
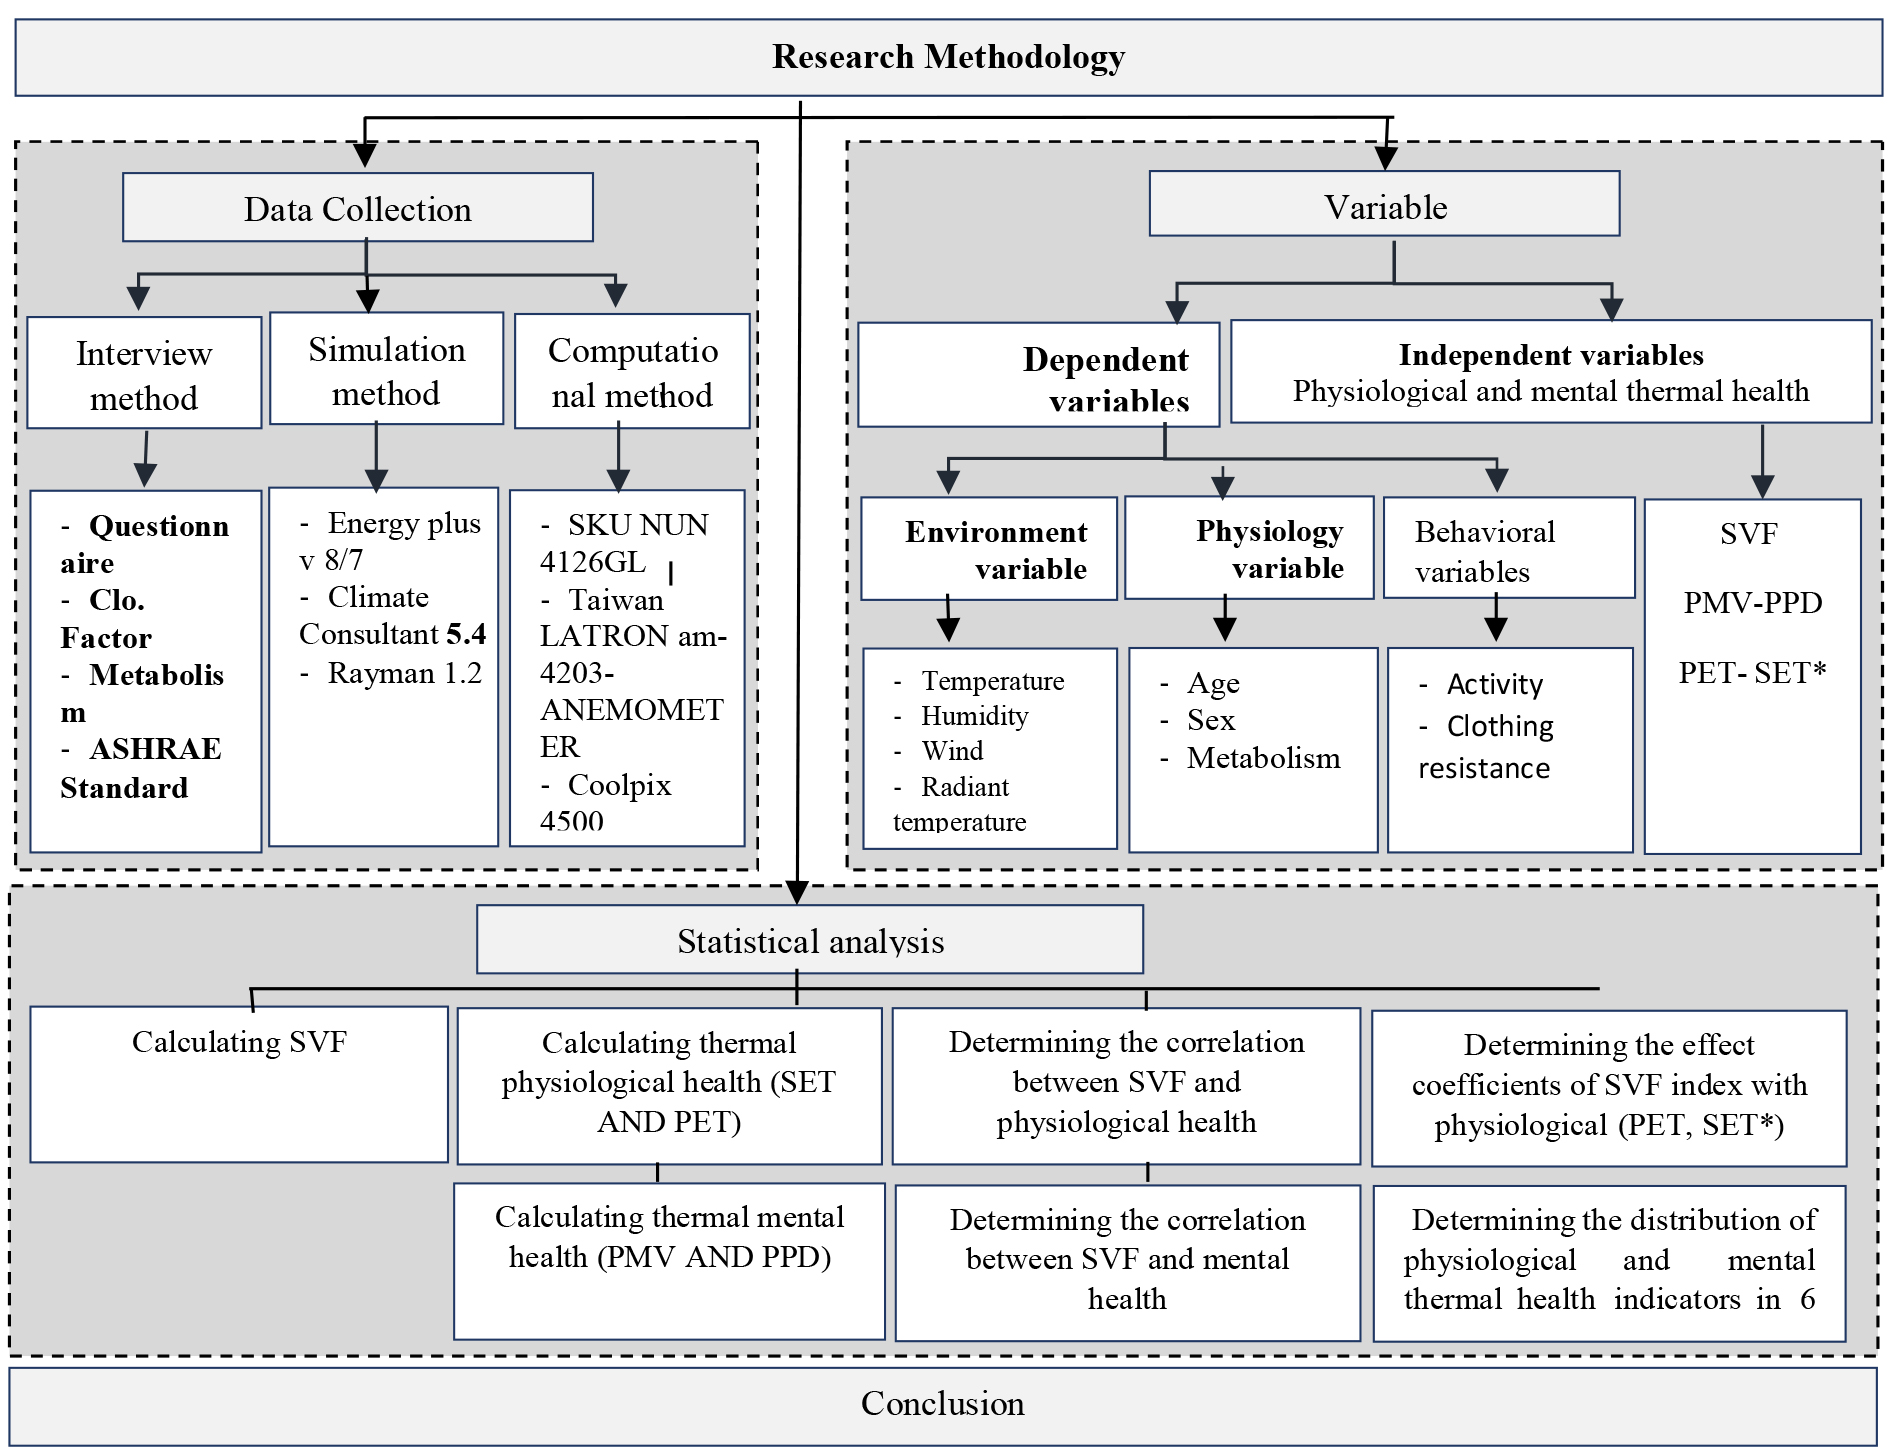
Figure 2. The figure shows the research method process.
3. Results
The thermal analysis method allowed extraction of SVF, physical, and mental health values from a thermal perspective, considering the geographical location of Shiraz, Iran and personal information of the students (height: 1.55 m, weight: 50.0 kg, age: 15, sex: f, clothing: 0.9 clo, and activity: 80.0 W). SVF and physiological/mental health were calculated using measurement, calculation, and simulation methods on the studied samples (Table 1).
| Station | SVF | Date | Mental Health | Physiological Health | ||
|---|---|---|---|---|---|---|
| PMV | PPD | PET | SET* | |||
| +3 _ -3 | % | °C | °C | |||
| 1 | 0.756 | 15.4.2022 | 1.32 | 47 | 22.3 | 21.7 |
| 15.5.2022 | 0.18 | 7,5 | 27.7 | 25.5 | ||
| 15.6.2022 | -1.14 | 55 | 33.7 | 29.6 | ||
| 2 | 0.442 | 15.4.2022 | 0.84 | 35 | 21.8 | 21.4 |
| 15.5.2022 | -0.3 | 12,5 | 25.6 | 24.3 | ||
| 15.6.2022 | -0.84 | 35 | 31.1 | 28 | ||
| 3 | 0.853 | 15.4.2022 | 1.5 | 48.75 | 22.4 | 21.8 |
| 15.5.2022 | 0.36 | 15 | 28.5 | 25.9 | ||
| 15.6.2022 | -1.17 | 62.5 | 34.3 | 30 | ||
| 4 | 0.480 | 15.4.2022 | 0.9 | 37.5 | 22 | 21.6 |
| 15.5.2022 | -0.24 | 10 | 25.8 | 24.4 | ||
| 15.6.2022 | -0.9 | 37.5 | 31.6 | 28.3 | ||
| 5 | 0.49 | 15.4.2022 | 0.9 | 40 | 22 | 21.6 |
| 15.5.2022 | -0.18 | 7.5 | 26 | 24.5 | ||
| 15.6.2022 | -0.96 | 37.5 | 31.6 | 28.3 | ||
| 6 | 0.529 | 15.4.2022 | 0.96 | 45 | 14.9 | 13.5 |
| 15.5.2022 | -0.12 | 5 | 26.2 | 24.6 | ||
| 15.6.2022 | -1.08 | 40 | 31.8 | 28.5 | ||
| ||||||
| SVF: Sky View Factor; PMV: Predict Mean Vote; PPD: Predicted Percentage of Dissatisfied; PET: physiological Equivalent Temperature; SET*: Standard Effective Temperature | ||||||
3.1. Findings of Examination of SVF and its Impact on Physical and Mental Health
This section discusses SVF and its physical and mental health implications. The findings were divided into seven sub-sections, as outlined below.
3.2. Calculating SVF
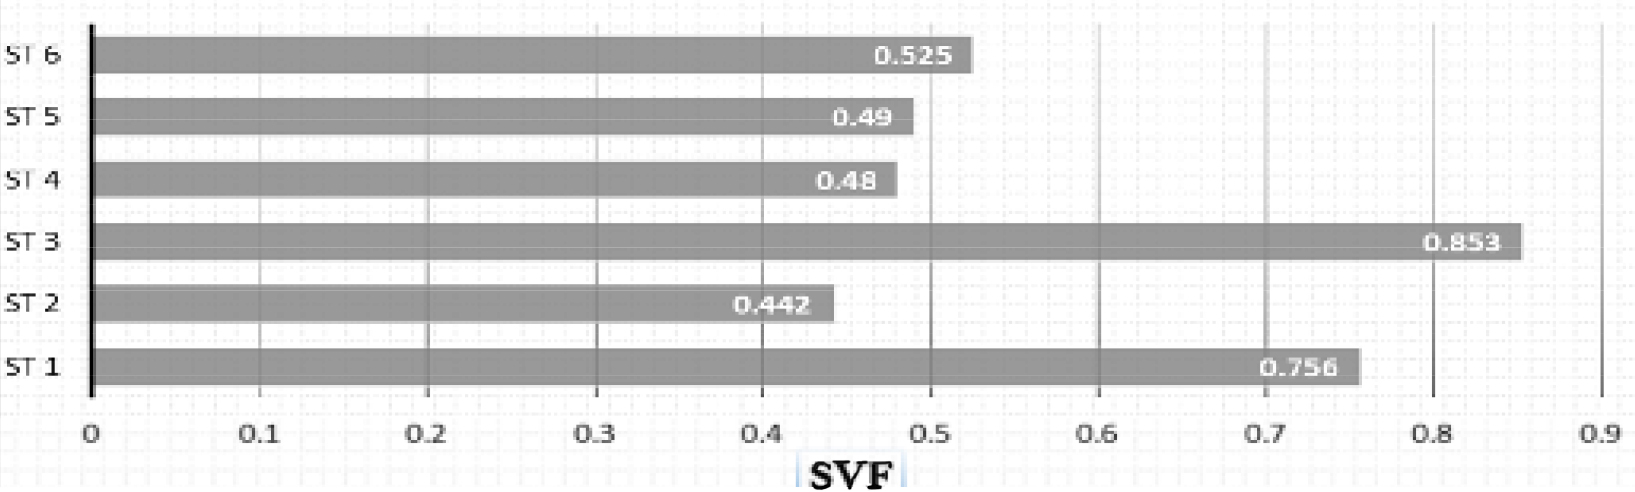
SVF values at six different stations ranged from 0.442 to 0.853. The highest SVF value was observed at Station 3, while the lowest was recorded at Station 2. SVF reflects the amount of sky visibility, and higher SVF in winter leads to increased solar radiation and reduced chances of feeling cold. Conversely, higher SVF in summer increases solar radiation and a greater likelihood of feeling hot (Table 1).
3.3. Calculating the Health Physics Aspect of Thermal (SET* and PET)
Figure 3 shows PET and SET* values on the 15th day of April, May, and June 2022. According to PET, Station 3 consistently had the highest values in all three months (22.4°C, 28.5°C, and 34.3°C), while Station 2 recorded the lowest values in May and June 2022 (25.6°C and 31.1°C). In April, the lowest PET value was observed in Station 6, and in terms of SET*, Station 3 also exhibited the highest values throughout the three months (21.8°C, 25.9°C, and 30°C), while Station 2 had the lowest values in both May and June (24.3°C and 28°C). In April, the lowest SET value was 13.5°C in Station 6.
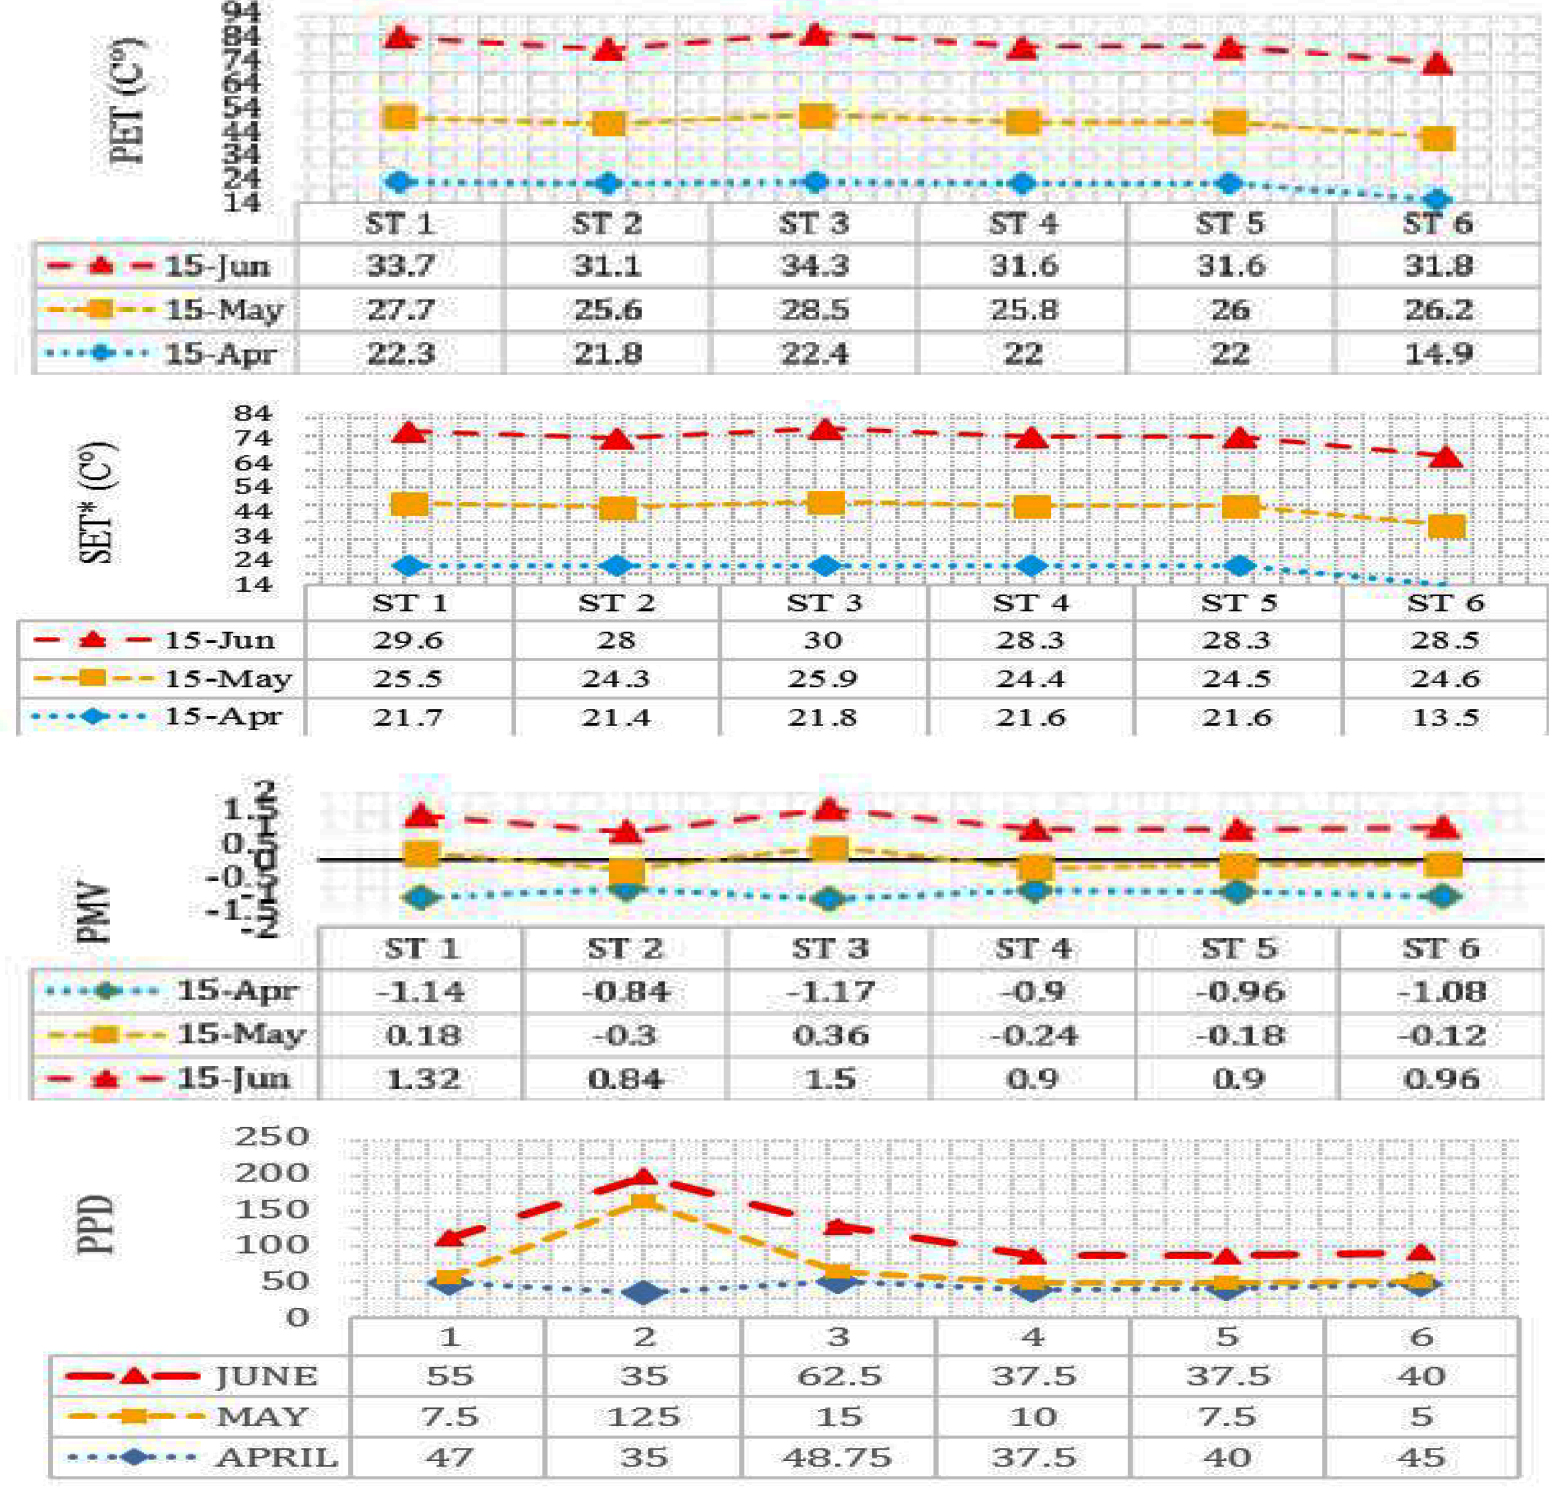
Figure 3. The figure shows the physiological (PET, SET) and mental thermal health (PMV, PPD) in 6 studied stations. PET: Physiological Equivalent Temperature; SET*: Standard Effective Temperature; PMV: Predict Mean Vote; PPD: Predicted Percentage of Dissatisfied.
3.4. Calculating the Mental Health Aspect of Thermal (PMV and PPD)
Figure 3 presents PMV and PPD values on the 15th day of April, May, and June 2022. According to PMV, Station 3 had the highest values in April and May (-1.17 and 0.36), while Station 2 had the best values in both months (-0.84 and 0.84). The best value was recorded in May in Station 4 (-0.12). Regarding PPD, Station 3 consistently showed the highest values in all three months (62.5%, 15%, and 48.75%), while Station 2 had the lowest values in June and April (35% and 35%) and Station 6 had the lowest value (5%) in May.
3.5. Correlation between SVF and Health Physics (PET, SET)
Since the study aimed to investigate the correlation between physiological health based on SVF, dependence diagrams were drawn between SVF and PET, SET*, and their linear Correlation were analyzed.
3.5.1. Correlation of PET and SVF: During the studied time frame, Station 3, with the lowest SVF value, was the hottest in all three months, coinciding with the highest value of PET in April, May, and June 2022. On the other hand, Station 2, with the lowest SVF value, was the coolest, corresponding to the lowest PET values in May and June. Figure 4 illustrates the linear equation and positive correlation between these two indicators. Additionally, as the months became warmer, PET value (Physiological Equivalent Temperature) increased. The linear equation y=4.503x+239.18 represents the correlation between the amount of PET and the SVF value, where ‘y’ is the PET and ‘x’ is the SVF value.
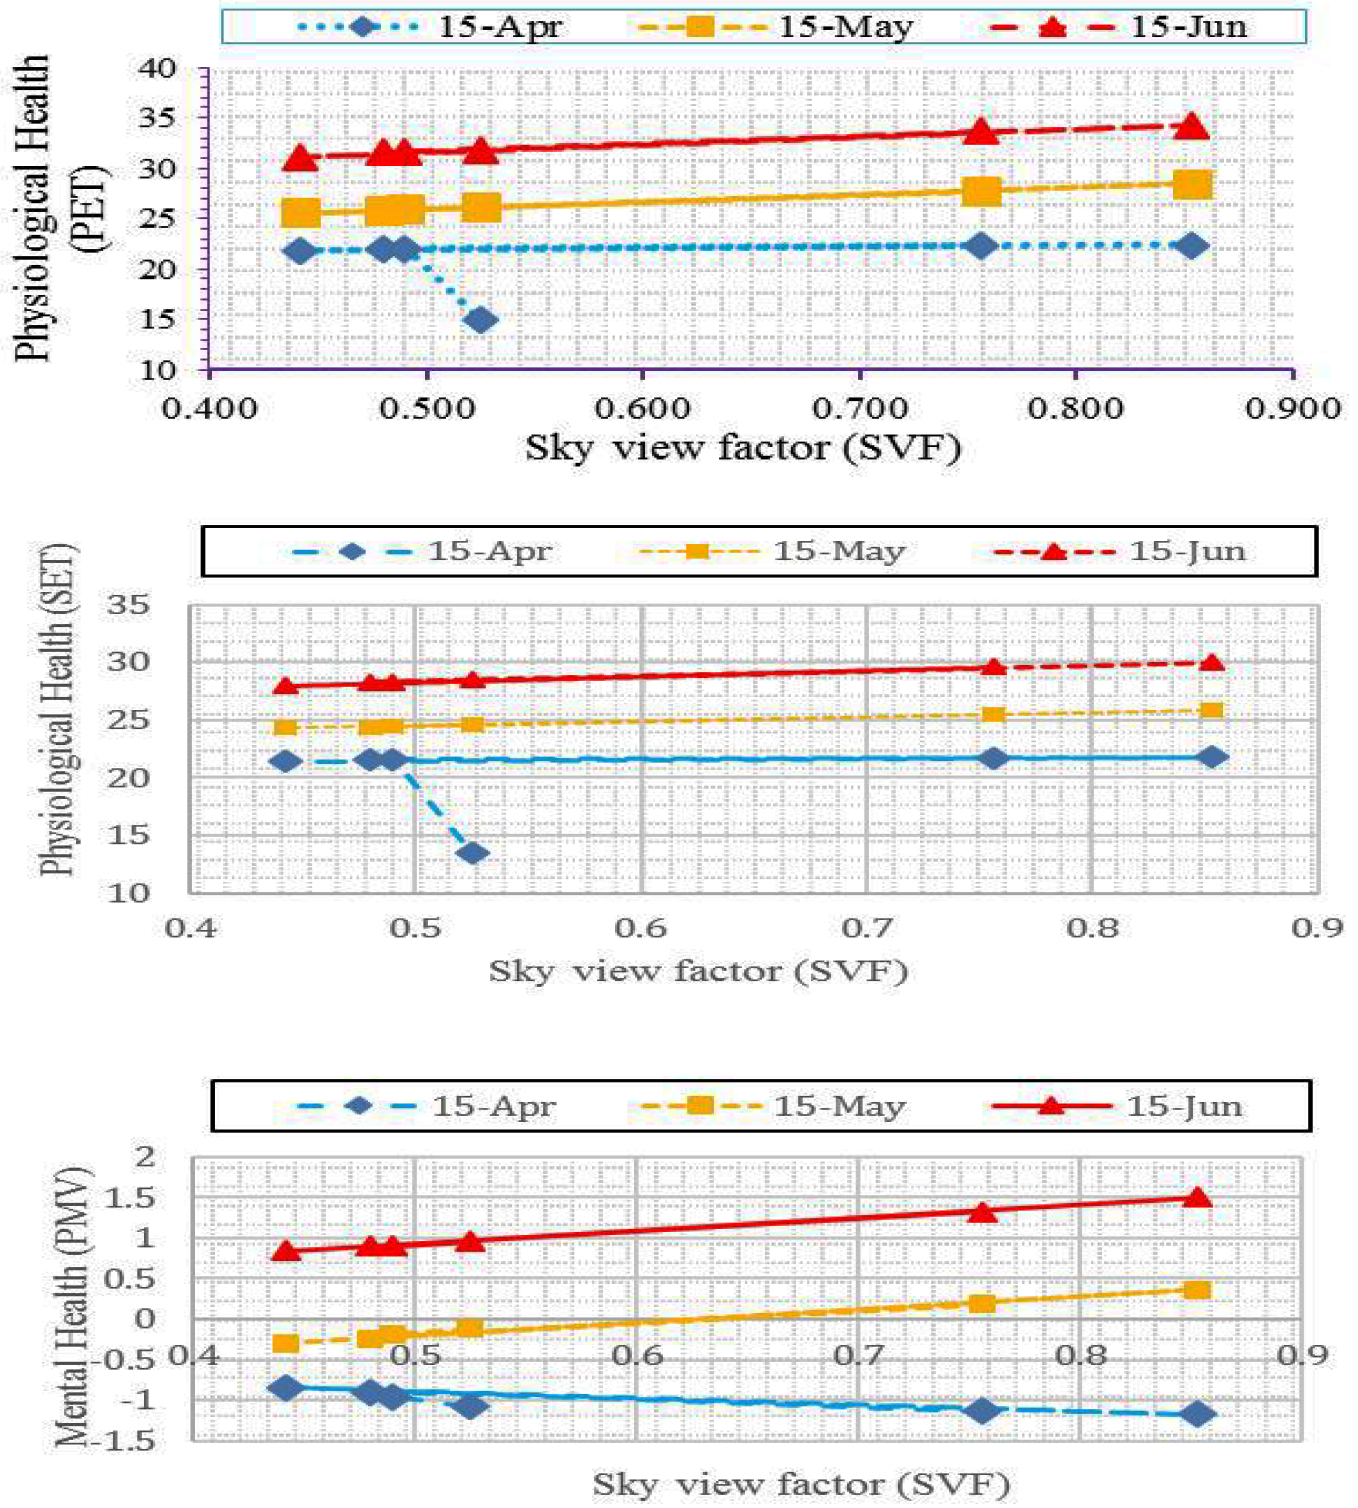
Figure 4. The figure shows the correlation of PET, SET, PMV and SVF. PET: Physiological Equivalent Temperature; SET*: Standard Effective Temperature; SVF: Sky View Factor; PMV: Predict Mean Vote.
3.5.2. Correlation of SET* and SVF: Similarly, during the studied time frame, Station 3, with the lowest SVF value, was the warmest, coinciding with the highest value of SET* in April, May, and June 2022. Conversely, Station 2, with the lowest SVF value, was the coolest, corresponding to the lowest SET* values in May and June. Figure 4 shows the linear correlation between SVF and SET*, which is direct. As the months turned warmer, SET* value (Standard Effective Temperature) also increased. The linear equation y=4.3692x+17.684 represents the direct correlation between SET* and SVF values, where ‘y’ is the SET* value, and ‘x’ is the SVF value. This equation shows that as the SVF value increases, the SET* value also increases linearly.
3.6. The Correlation between SVF and Mental Health (PMV and PPD)
Dependence diagrams were drawn between SVF and PMV to investigate the correlation between mental health based on SVF. Their linear correlation was plotted to determine the maximum sensitivity to changing parameters.
3.6.1. Correlation of PMV and SVF: The current study showed an inverse correlation between SVF and PMV values in April, May, and June 2022, considering the absolute value of PMV. As the months got warmer, the absolute value of PMV (Predicted Mean Vote) increased, indicating more significant thermal discomfort. Station 3, with the lowest SVF value, experienced the highest absolute PMV values in April and May as compared with other stations. Meanwhile, Station 2, with the lowest SVF value, had the lowest absolute PMV values in April and June. The correlation between PMV and SVF can be represented by the linear equation y=-0.6991x-0.6018, which shows the amount of PMV per SVF. Since PPD (Predicted Percentage of Dissatisfied) depends on PMV, these two indices have a similar correlation with the SVF index (Figure 4).
.7. Coefficients of SVF with (PET, SET*) and (PMV, PPD)
Table 2 presents the coefficients of physiological and mental health models based on SVF. Coefficients for PMV and PET were negative, indicating that higher SVF led to lower thermal health from April to June 2022. The impact coefficients for PMV from April to June were -16.937, -21.98 and -23.844, indicating that as SVF increased, PMV became more unfavorable and decreased. The study suggested that SVF significantly affects the thermal health of open school spaces, with a more substantial impact on physical and mental well-being. The Standard Error (SE) for each coefficient (PMV, PET, SET) in all months (April, May, June) is 0.05.
| PMV | PET | SET | ||
|---|---|---|---|---|
| SVF | APRIL | -16.937 | -2.4073 | 16.811 |
| MAY | -21.98 | -2.8322 | 19.918 | |
| JUN | -23.844 | -2.9862 | 19.58 | |
| SE | 0.05 | 0.05 | 0.05 | |
| SVF: Sky View Factor; PMV: Predict Mean Vote; PPD: Predicted Percentage of Dissatisfied; PET: Physiological Equivalent Temperature; SET*: Standard Effective Temperature | ||||
3.8. Determining the Distribution of Thermal Health Indicators in 6 Studied Stations
Figure 5 illustrates the dispersion in thermal health models as compared with SVF. The data in Station 6 are considered as an outlier compared with the linear trend. Further investigations revealed that the direction of trees influences the changes in this station. In Station 5, the shade trees are on the east side, while in Station 6, the trees are on the southeast side, where the students sit.
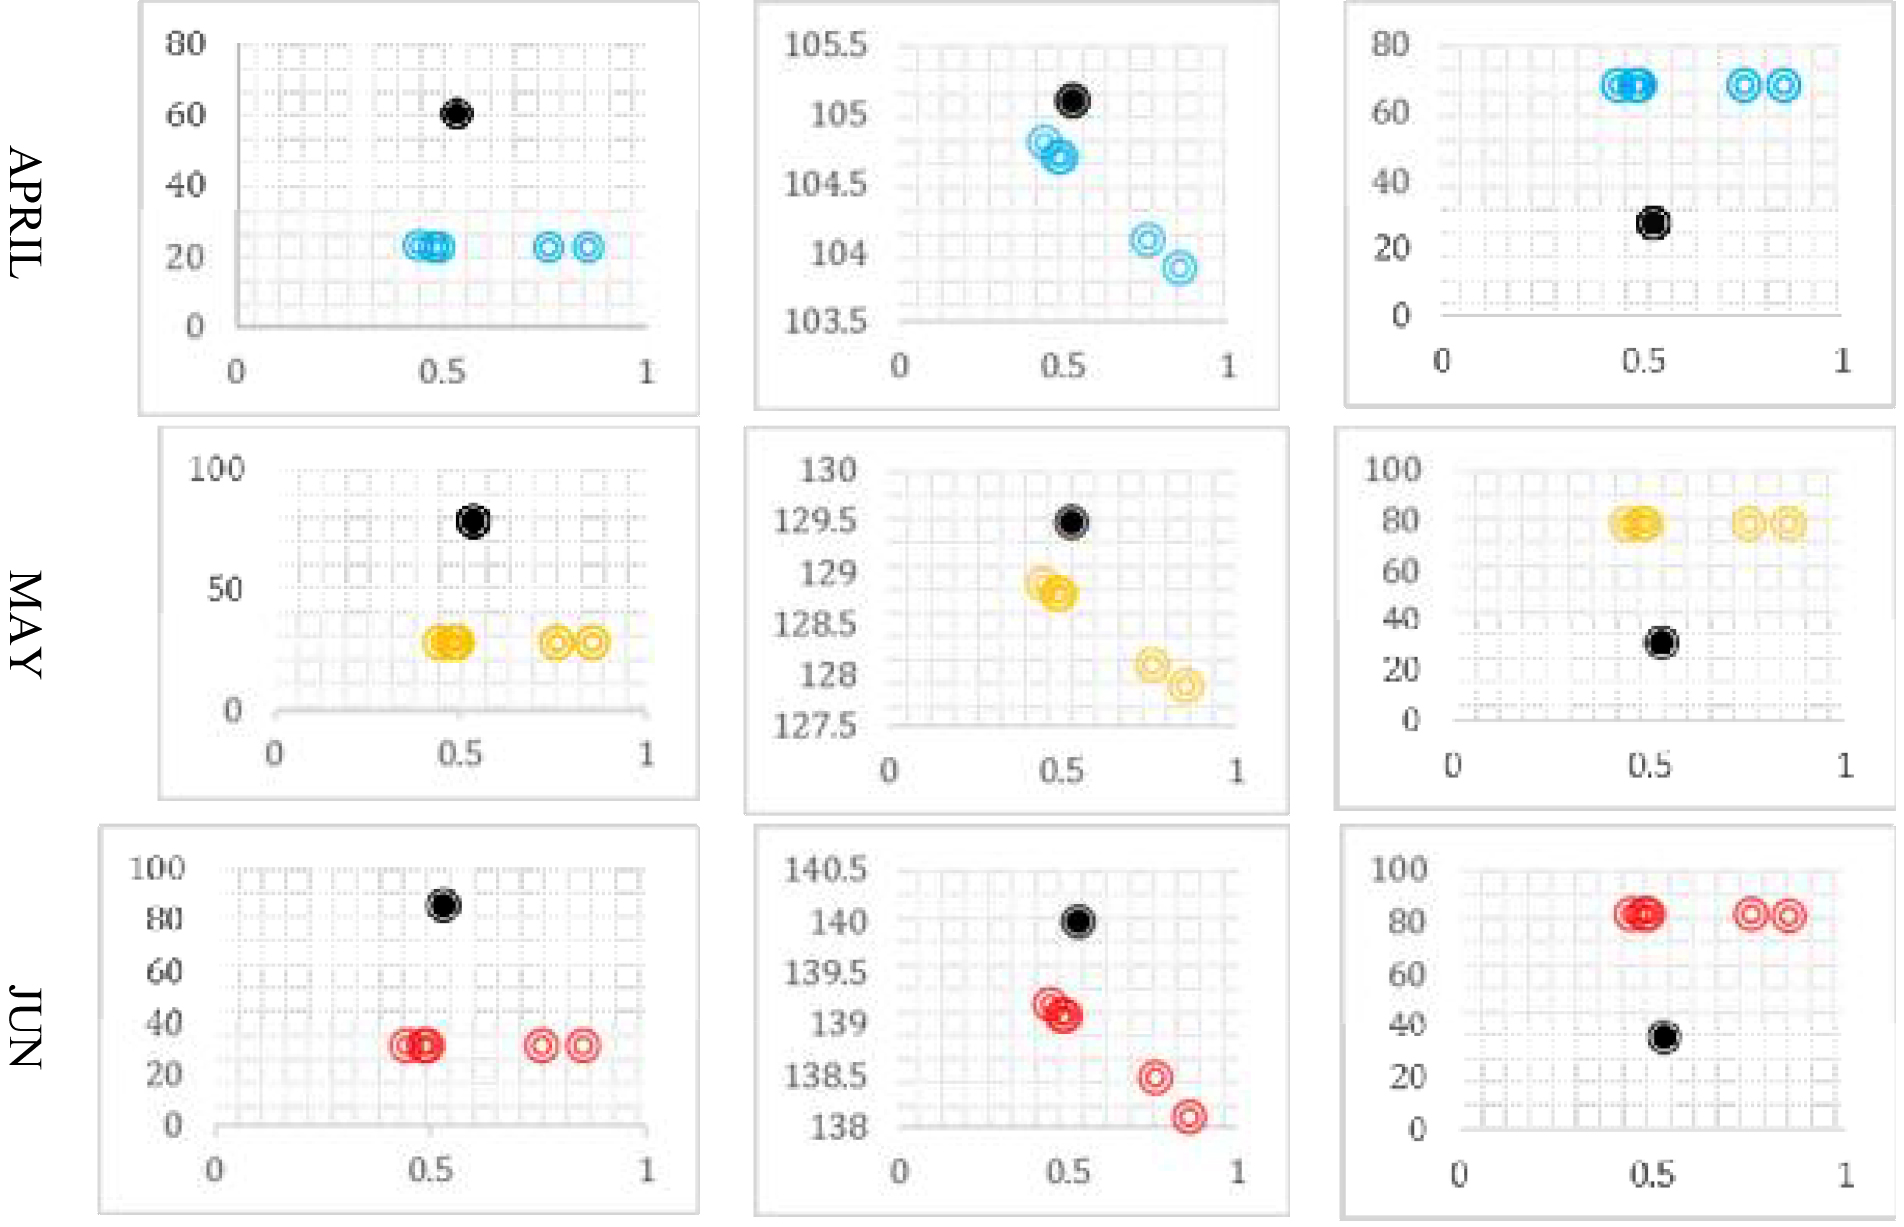
Figure 5. The figure shows the distribution of physiological and mental thermal health indicators in 6 studied stations
4. Discussion
The present study investigated the effect of SVF on the physiological and mental thermal health of first-secondary girls’ school in Shiraz, Iran, from April to June 2022.
1. Station 3 had the highest SVF among the six stations, while Station 2 had the lowest SVF.
2. Station 3 exhibited the highest PET and SET* indices values throughout the three months, while Station 2 had the lowest values in May and June. In April, the lowest value was observed in Station 6.
3. Station 3 had the highest PMV values in April and May, while Station 2 had the best PMV values in both months. In May, Station 4 had the best PMV value of -0.12. Furthermore, Station 3 had the highest PPD values over the three months, Station 2 had the lowest PPD values in June, and Station 6 had the lowest PPD values in April and May at 5%.
4. Station 3, with the lowest SVF, experienced the highest temperatures with the highest numerical value of PET over the three months. On the other hand, Station 2, with the lowest SVF, had the coolest temperatures in May and June. The amount of PET showed a direct linear correlation with SVF in all three months.
5. Station 3, with the lowest SVF, was the warmest throughout the studied period, corresponding to the highest SET* values every three months. Station 2, with the lowest SVF value, was the coolest, corresponding to the lowest SET* values in May and June 2022, while SET* values increased as the months became warmer. The data revealed a direct linear correlation between SET* and SVF in all three months.
6. Studies indicated an inverse linear correlation between SVF and the absolute value of mental thermal health over three months. As the months became warmer, the numerical value of PMV (Predicted Mean Vote) increased accordingly. Specifically, Station 3, with the lowest SVF, experienced the warmest temperatures and the highest numerical PMV values in April and May 2022. In contrast, Station 2, which had the lowest SVF, was the most favorable, exhibiting the lowest numerical PMV values in April and June.
7. PPD was not independent; PPD depended on PMV, resulting in similar correlations with SVF.
8. Coefficient of SVF on physiological and mental thermal health was calculated, revealing that the impact of SVF on physiological health outweighed its effect on mental health.
9. Scatter diagrams of thermal health in the six studied stations revealed that Station 6 was an outlier. All shade trees in stations 1 to 5 were benches in the east direction, while only in Station 6, shade trees were in the southeast. The geographical direction of tree placement relative to the bench significantly affected the provision of thermal health, requiring further research.
4.1. Limitations
The different season and the orientation of trees were considered as the limiting factors in this study. Accordingly, Summer, which has the greatest thermal impact on thermal health, was selected. Additionally, trees located on the eastern side of the bench were examined. In future studies, it is recommended to investigate thermal health conditions in cold seasons and among other age and gender groups.
5. Conclusion
Despite the significant importance of schools and students’ health, the influence of SVF in schoolyards on the thermal health has not been addressed. The present study aimed to elucidate the influence of SVF on the thermal health of students from both physical and mental perspectives, and reveal the respective impact of each. The present study demonstrated that SVF values have a linear and direct effect on PET and SET* while having a linear and reverse effect on the absolute value of PMV and PPD during all three months. Higher SVF led to lower thermal health, while lower SVF resulted in higher thermal health in hot months. Visibility to the sky indicate the presence of green spaces and trees, thus providing more shade in semi-hot and dry climate schools. Consequently, placing sitting areas for students in the schoolyard near trees and shaded spaces reduced SVF and improved thermal health, both physiologically and mentally, in outdoor spaces. The presence of shade during the studied hours in this season was desirable. However, providing summer shade and receiving winter radiation depend on the precise shade design in schools in semi-hot and dry climates, requiring further research.
Acknowledgment
This article was extracted from the PhD Thesis of Ms. Mahboobeh Sadat Mirshamsi entitled “Daylight Gaining Optimization regarding Thermal comfort in Educational Buildings, (Case Study Shiraz semi-Warm and Arid Climate).
Ethical Approval
Considering that the questionnaire and sampling were not used in this article, and only standards were employed, the ethical code for conducting the research was not applied. The present article was extracted from confirmed proposal with tracking code 162275509 and thesis code 11160202962012 at the Islamic Azad University, Mashhad Branch.
Authors’ Contribution
Mahboobeh Sadat Mirshamsi: Substantial contributions to the conception and design of the work, interpretation of data for the work, drafting the work and reviewing it critically for important intellectual content. Heidar Jahan Bakhsh: Substantial contributions to the design of the work, reviewing the work and it critically for important intellectual content, Mohsan Vafamehr: Acquisition and analysis of data, reviewing the work. Zahra Barzegar: Substantial contributions to the conception and design of the work, interpretation of data for the work, drafting the work and reviewing it critically for important intellectual content. All authors have read and approved the final manuscript and agree to be accountable for all aspects of the work, such that the questions related to the accuracy or integrity of any part of the work.
Conflict of Interest
None declared.
References
- Aghamolaei R, Azizi MM, Aminzadeh B, O’Donnell J. A comprehensive review of outdoor thermal comfort in urban areas: Effective parameters and approaches. Energy & Environment. 2022; 34(6):2204-27. DOI
- Mohammadi M, Barzegar Z. The Impact of Wind on Ambient Temperature and Thermal Comfort through Wind Catcher by Employing PMV-A Case of Salehi’s House in Shiraz, Iran. Iran IJAUP. 2019; 29(2):213-222. DOI
- Shrestha M, Rijal HB, Kayo G, Shukuya M. A field investigation on adaptive thermal comfort in school buildings in the temperate climatic region of Nepal. Building and Environment. 2021; 190:107523. DOI
- Zomorodian ZS, Aminian S, Tahbaz M. Thermal Comfort Assessment in Classrooms in the Hot and Dry Climate of Iran Field Survey in a Primary School of Kashan. Journal of Fine Arts: Architecture & Urban Planning. 2017; 21(4):17-28. DOI Persian
- Najafi N, Movahed K, Barzegar Z, Samani S. The effect of thermal comfort on stress in female high school students. Int J School Health. 2018; 5(3):1-6. DOI
- Mansi SA, Barone G, Forzano C, Pigliautile I, Ferrara M, Pisello AL, et al. Measuring human physiological indices for thermal comfort assessment through wearable devices: A review. Measurement. 2021; 183:109872. DOI
- Enescu D. A review of thermal comfort models and indicators for indoor environments. Renewable and Sustainable Energy Reviews. 2017; 79:1353-79. DOI
- Jastaneyah Z, Kamar H, Al Garalleh H. A Review Paper on Thermal Comfort and Ventilation Systems in Educational Buildings: Nano-Mechanical and Mathematical Aspects. Journal of Nanofluids. 2023; 12(1):1-17. DOI
- Huang L, Zhai Z. Critical review and quantitative evaluation of indoor thermal comfort indices and models incorporating solar radiation effects. Energy and Buildings. 2020; 224:110204. DOI
- Kim J, Lee DK, Brown R, Kim S, Kim J-H, Sung S. The effect of extremely low sky view factor on land surface temperatures in urban residential areas. Sustainable Cities and Society. 2022; 80:103799. DOI
- ZarifianMehr A, Jahanshahloo L, Alijani B, Zabih H. A Review of the Definitions and Calculation Methods of Sky View Factor. Armanshahr Architecture & Urban Development. 2020; 13(31):207-23. DOI
- Holmer B, Postgård U, Eriksson M. Sky view factors in forest canopies calculated with IDRISI. Theoretical and Applied Climatology. 2001; 68:33-40. DOI
- Dirksen M, Ronda RJ, Theeuwes NE, Pagani GA. Sky view factor calculations and its application in urban heat island studies. Urban Climate. 2019; 30:100498. DOI
- Wang R, Liu R, Chen Q, Cheng Q, Du M. Effects of Sky View Factor on Thermal Environment in Different Local Climate Zoning Building Scenarios—A Case Study of Beijing, China. Buildings. 2023; 13(8):1882. DOI
- Lam CKC, Weng J, Liu K, Hang J. The effects of shading devices on outdoor thermal and visual comfort in Southern China during summer. Building and Environment. 2023; 228:109743. DOI
- Khalili S, Fayaz R, Zolfaghari A. Analyzing outdoor thermal comfort conditions in a university campus in hot-arid climate: A case study in Birjand, Iran. Urban Climate. 2022; 43:101128. DOI
- Fanger PO. Assessment of man’s thermal comfort in practice. Occupational and Environmental Medicine. 1973; 30(4):313-24. DOI
- Zhao Q, Lian Z, Lai D. Thermal comfort models and their developments: A review. Energy and Built Environment. 2021; 2(1):21-33. DOI
- Fröhlich D, Matzarakis A. Calculating human thermal comfort and thermal stress in the PALM model system 6. Geoscientific Model Development 2020; 13(7):3055-3065. DOI
- Hardy JD, Stolwijk JAJ, Gagge AP. In: Whittow GC, editor. Mammals: Academic Press; 1971.
- Taleghani M, Kleerekoper L, Tenpierik M, Van Den Dobbelsteen A. Outdoor thermal comfort within five different urban forms in the Netherlands. Building and Environment. 2015; 83:65-78. DOI
- Olgyay V. Design with climate: bioclimatic approach to architectural regionalism: Princeton University Press; 2015.
- Szokolay S. Thermal comfort and passive design. Engineering, Environmental Science. 1985. DOI
- Givoni B. Man, climate and architecture. London: Applied Science Publishers; 1976.
- Zare S, Hasheminejad N, Shirvan H, Hemmatjo R, Sarebanzade K, Ahmadi S. Comparing Universal Thermal Climate Index (UTCI) with selected thermal indices/environmental parameters during 12 months of the year. Weather and Climate Extremes. 2018; 19:49-57. DOI
- Gagge AP, Stolwijk JAJ, Nishi Y. An effective temperature scale based on a simple model of human physiological regulatory response. Ashrae Trans. 1971; 77:247-62.
- American National Standard. Ventilation for acceptable indoor air quality: American Society of Heating, Refrigerating and Air-Conditioning Engineers; 2001.
- Sirhan N, Golan S. Efficient PMV computation for public environments with transient populations. Energy and Buildings. 2021; 231:110523. DOI
- Miao C, Yu S, Hu Y, Zhang H, He X, Chen W. Review of methods used to estimate the sky view factor in urban street canyons. Building and Environment. 2020; 168:106497. DOI
- Zeng L, Lu J, Li W, Li Y. A fast approach for large-scale Sky View Factor estimation using street view images. Building and Environment. 2018; 135:74-84. DOI
- Bernard J, Bocher E, Petit G, Palominos S. Sky view factor calculation in urban context: computational performance and accuracy analysis of two open and free GIS tools. Climate. 2018; 6(3):60. DOI
- Shehata AM. Sustainable-Oriented Development for Urban Interface of Historic Centers. Sustainability. 2023; 15(3):2792. DOI
- Jamali M, Moghimi E, Jafarpour ZA. Geomorphology of Karst features of Shiraz City and Arjan Plain and development limitations. International Journal of Environmental, Chemical, Ecological, Geological and Geophysical Engineering. 2015; 9(1):25-31. DOI
- Lin T-P, Matzarakis A, Hwang R-L. Shading effect on long-term outdoor thermal comfort. Building and Environment. 2010; 45(1):213-21. DOI
- Omidvar K, Ebrahimi R, Jamshidi Motlagh M. Investigating the Effect of Sunspots on the Temperature of Kerman and Shiraz Stations during the Last Half Century Using Wavelet Analysis. Journal of Geography and Environmental Hazards. 2016; 5(3):17-36. DOI Persian


